Introduction
Hello everybody. As we all know, due to the numerous problems encountered in the development methodology telecomHall, I stopped sending macros, code, files, etc… Of course, I have suspended the accounts of all subscribers until then, they are no longer charged for anything more.
However, many of you asked me to continue, even though he was just teaching some algorithms, standard procedures, etc… And I’ve had articles ready for publishing weekly. Anyway, the tool, or complete system exists, and I use. It has even more modules than those shown in the Roadmap, tutorials are published or not.
We will then resume our contact now more focused teaching of the idea, the design of all tools that I created and still create. Tools and procedures for Telecom and IT, resulting in an exceptional productivity with time saving, minimizing errors, standardization, among numerous other advantages.
How am I alone, and only have time evening and weekend to work on the site, it becomes very difficult (one of the points that made me stop temporarily telecomHall). Even so, I’ll try. Please excuse the errors of the review, especially if you’re reading this in a language other than Portuguese. : (
Only I would also like to inform you that we are * developing a course that will begin very soon to be available. Will be completely free, and have this very simple language that you are familiar with the articles of telecomHall. (* I and some members who are participating. You may also be part of creating this course. Click here to know more).
Today I’ll write an application pretty simple: gather information from all sites of other carriers in one place, serving as excellent support both for coverage evaluation of competitor - benchmarking - as well as a source of information for possible sharing requests.
Objective
Plot the sites of all operators in Google Earth, based on Excel spreadsheets with information from the same sites, making the grouping - merge - in Excel spreadsheets and processing and creation of KML files in Access.
Note: The information in latitude and longitude of the operators are provided by regulatory agencies and / or related entities. Each country has its own format available, and would be impossible to cover in one application, and must choose one country for demonstration. In this case, we choose as a country Brazil, and ANATEL as a data source.
The tutorial will demonstrate today how the process should be done in general, and adjustments must be made according to the characteristics of each specific format.
File Structure
Because this is a new module of our tool Hunter, the first thing to do is create the default directories. Remember that following this organized structure is easier to integrate all the modules, as seen in previous tutorials. Anyway, you can learn here, and create their own structure.
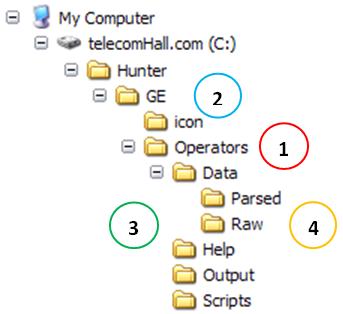
Following our suggestion, first create the directory Operators (1), just below the existing directory GE - yes, this is a submodule Hunter Google Earth. Note that we have created the directory icon (2), which will be used - it contains images that are used by the KML file, and is a directory common to other modules.
Just below Operators create the directories whose functions are already known in Date, Help, Output, and Scripts (3).
Finally, two new subdirectories of Data: Raw Parsed and (4), respectively containing the raw data - Excel spreadsheets or even other files with information from operators, and the data processed, ready to be imported.
It is easier to see in the picture.
Cut to the chase?
We begin with a truth in the world of programming: if you copy a lot!
Relax, we’re not talking about piracy. We are totally against it! But when it comes to programming, you will not be reinventing the wheel whenever you need something new. Mainly because in the programming area there are several websites that specialize in helping in the creation of codes.
The general rule of most websites is that you can use the examples provided in their applications, provided you keep the author credits. It’s much more decent credit the author, who was trying to look like you ‘created’.
This is the case today. In a part of our application - as we shall see very soon - we need to gather information from multiple spreadsheets into one. And for this, we use the excellent example of an MVP (Most Valuable Professional), or other single words, professional experts recognized by Microsoft, the site http://www.rondebruin.nl/, Ron de Bruin.

On the site you will find complete documentation on our example (Merge Excel Workbooks), and various other useful information. Of course, if you do not have much experience with VBA, you can find a little tricky. But always keep learning, and soon you will see websites like Ron de Bruin and others - MVP or may not be valuable to help us improve.
What are we doing today?
Now let’s see what we do today. For convenience, we split into two parts.
Group data from carriers in Brazil (FCC Raw) in a single worksheet (Merged), and put them in the proper format (Parsed) using Excel.
Although it may seem a trivial task, there are some special treatments to be made. This will be subject to the tutorial Hunter Parser, but in short we take data from all sheets and create a single planilha.Dá on hand to do it for sure. The main objective is to demonstrate that we can use the programming for us to solve any challenge that computer to appear.
Import data from this spreadsheet into Access, and do some more treatments (using auxiliary tables and queries) and plot the data in KML files.
Itself can also be considered a trivial task, but show some very interesting tips.
In short it is, but the development track, learn and let your creativity free, seeing how solutions are being implemented.
Part One: Grouping and Handling Excel files (Data of Operators)
Since it is not our main goal to teach programming, but the ideas go, this part is not very detailed. Let’s just show what is done by macros. In case of any doubt or need further explanation, please contact us.
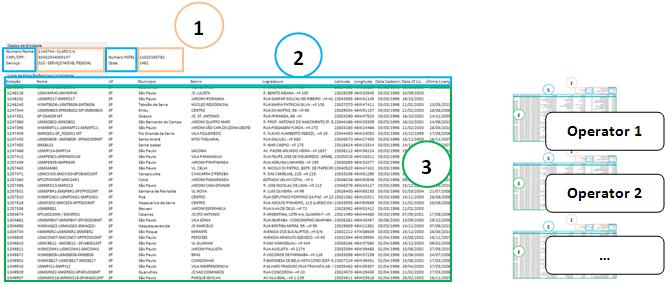
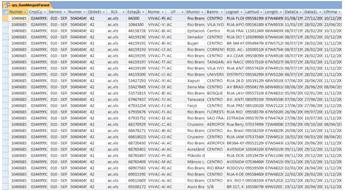
The public archives with data from sites of Anatel has the format shown below, and to complicate our life, is not totally tabular. It has a header (1) and one part with data from stations such as latitude and longitude (2). Our problem is we need to repeat the common data header next to each matching record. And to complicate matters, each state file comes with data carriers below the other.
Grouping Excel spreadsheets with a Macro
The data is provided by the state (UF), and this is the origin of our need for the first macro, there are 27 states in the case of Brazil! To group all at once, we use the function RawMerged (), which is an adaptation of code from Ron de Bruin.
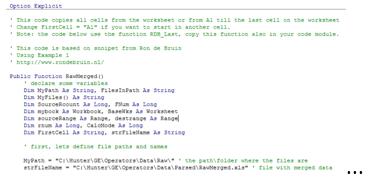
This function can be found adapted in our Excel file which is responsible for the first part of the process. Hunter_GE_Operators_BR_1.0_RUN.xls, located in the Scripts directory.

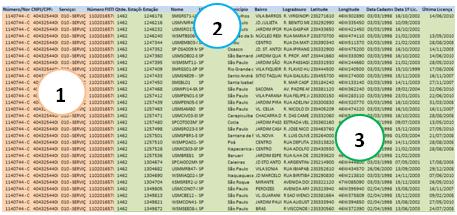
Parsing Excel spreadsheets with other Macro
Also in this file have a second role, responsible for putting the common data header alongside data sites. After their rounds both functions (you can run macros using the RUN button of the master spreadsheet, or press ALT F11 and run from the VBE, as we saw with the F5 key)
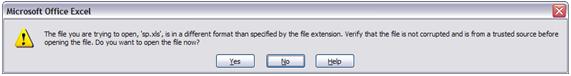
Note 1: Depending on your version of Excel, it may be that a message appears stating that it is not in the format informed by the extension. Disregard and click open anyway.
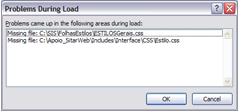
Note 2: Another detail is that this file references the style sheets, you do not have on your machine. Simply click OK.
Ready. Now, back to the rhythm a bit more detail than you’re used to. This for three reasons:
- The first part - the application that gathers and treats the data is specific to the data format of one country (Brazil).
- This application can be seen in its original form on the website indicated;
- And third and most important: what you need as a result of the first part is at least one table with data from the Operator, Latitude and Longitude. Other fields may be considered desirable, but are only optional. That is, if you have a spreadsheet - table - with data from all carriers, you can adjust the second part according to their needs.
Part Two: Importing Data and Generating KML
From now on we will use our second file, also located in the Scripts directory. Is the file Hunter_GE_Operators_BR_1.0_RUN.mdb. Note: while not having these files, you can learn how everything is done, as we show here. If you have any questions, just contact us. Even in the forums will be discussing about the applications (as well).
This file holds the process into two parts, which can run from two macros:
Import_RawMergedParsed_RUN: that imports data from Excel file to the table RawMergedParsed; Pretty simple, as we shall see seguir.Plot_Operators_KML_RUN: qry_Operators_KML that uses the query as the data source to create the KML file. Remember that we have seen in detail in other tutorials how to create KML files via VBA code, and it is important that you have already learned this. Otherwise, we recommend that you redo some tutorials.
Importing Data
Here is the function that it is the Excel spreadsheet to the table RawMergedParsed.xls RawMergedParsed our database.
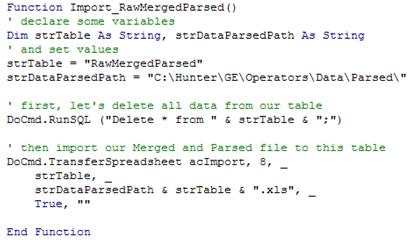
Pretty simple, just using the command TransferSpreadsheet and the arguments as shown.
One detail that is to use the command DoCmd.RunSQL. This command is used to erase the data from our table where we will import the data. Good practice, since we do not duplicate any data - only the data file and then imported.
Generating KML
A first information. Data processed by our first part (Excel Macros) generated in the spreadsheet format you want, but with some blank lines. When the file is imported, the lines appear in the table.
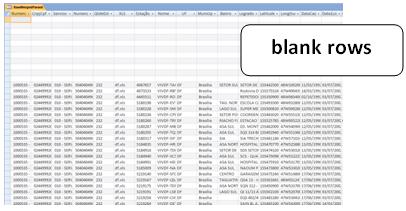
This is no problem. Of course we could have included a few lines in Excel macros to handle this little problem.
But let’s see how to resolve this using a query in Access. For this, we create a query showing all table data RawMergedParsed, only excluding blank lines. We can do this by entering a channel <> “” in our new consultation qry_RawMergedParsed.
Okay, solved the problem of blank lines, and our data table is actually the query qry_RawMergedParsed.
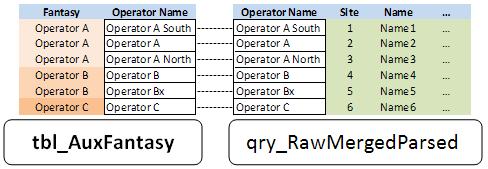
But now more than a little problem. And more useful to show an excellent application of auxiliary tables and queries. The problem is: depending on the region, there are different names - affiliates - for each carrier. And we want to plot the data using the assumed name only, not multiple names for each branch.
To understand better, see the figure below. To solve our problem, simply create an auxiliary table with the field mapping of subsidiaries and joint correposndente Fantasy name.
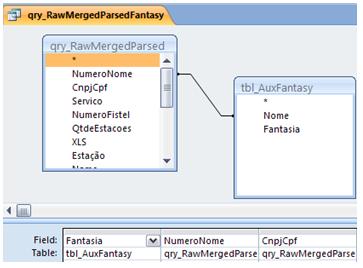
And how to do this in a new appointment? Simple, create a new query, add the table tbl_AuxFantasy qry_RawMergedParsed and consultation. Join the field with the name of Filiasi as shown below, and add the name of the new Fantasy qry_RawMergedParsedFantasy consultation.
Alright, we’re almost there. Let’s just do some more interesting things. As in our case the files have the date of activation of each site, we create a field with the date, so that we can generate files for each subgroup. Explaining, for example create a new calculated field ‘Year’, and then we can create files with data for each year. For the year from a date in VBA use the function Year ().
Note: There are some other calculated fields, such as Latitude and Longitude, but only to put math in decimal format. This is not relevant, mainly because the data you could use in his country may already provide the Latitude and Longitude in decimal format.
So we created our third and final consultation qry_Operators_KML, using the previous query - which now has the fancy name - and with calculated fields required. Recalling that in fact we would need the Trade Name, Latitude and Longitude. But in other fields, such as date, we can do a little better presentation.
Some details of the VBA code
Worth talking mai some new commands and tips used in VBA code to generate KML files.
The first one is: we have the information year, and for a better presentation, we will generate the files for years (which in the case from 1992 to 2010). But we also want to generate the total, ie only one file, containing all information for all years.
There are several ways to do this, and we show one.
This is the piece of code that does this. The following explains a little more.
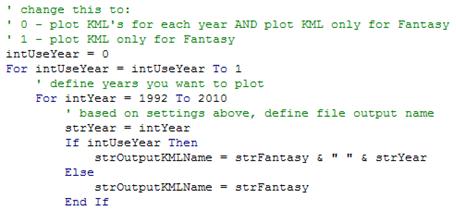
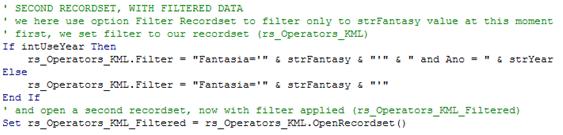
First, we define a variable intUseYear to indicate whether we want to use the Year also in plots or not. If its value is assigned by us equal to zero, then runs twice, but only one wheel. And every time I run, inside the loop we use this value to set the recordsets and filters accordingly.
RecordSet Filter
A cool new use of the recordset that we use today is the ability to make filters. And that’s the way we did in this example from today, for the demonstration.
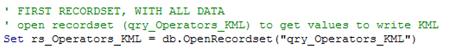
In summary, first open a recordset with all the data.
Then, based on the chosen filter, open the second recordset.
Well, the biggest news in VBA for today are these. Keep practicing, do Internet searches (Google). Increase your knowledge every day, discover new uses and opportunities of each function or command.
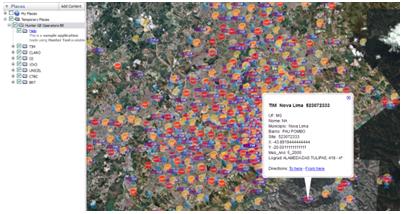
Final Result
Our final result, specifically to Brazil since we use the data from this country as an example is shown below.
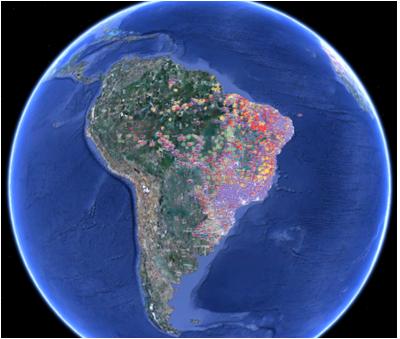
Note that a use of files generated per year is that it becomes easy for you to identify the stations of a particular operator in a year or more.
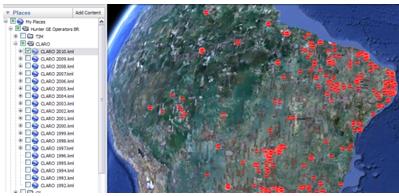
One interesting use is also navigate to a specific area, and get detailed information on the site - simply click on it!
Besides the use as an aid in RF Surveys - sharing requests - and Coverage Evaluation of other carriers, you can create reports with excellent presentation. Can still work with data in Excel and generate graphs showing the evolution of each operator, for example. All this you can do with the data is acargo your creativity!
Conclusion
In this tutorial we demonstrate how to use macros in Excel and Access to gather information from all sites of other carriers in one place, serving as excellent support both for coverage evaluation of competitor - benchmarking - as well as a source of information for possible sharing requests.
We saw some new features such as VBA Recordset Filters. Increasingly we will use these resources in order to get applications to facilitate our work, improve our performance and productivity. The result can be different: we stand out wherever you are working.
Once again the invitation is for you to participate more, and also to read and learn all the tutorials.
And be sure to visit the newly launched forum. Post your question, whatever your area of expertise in IT, Telecom and / or programming.
Download
Download Source Code: Blog_020_Hunter_GE_Operators.zip (720.9 KB)
ATENTION: Above is NOT the Map, instead is the Code to generate map.