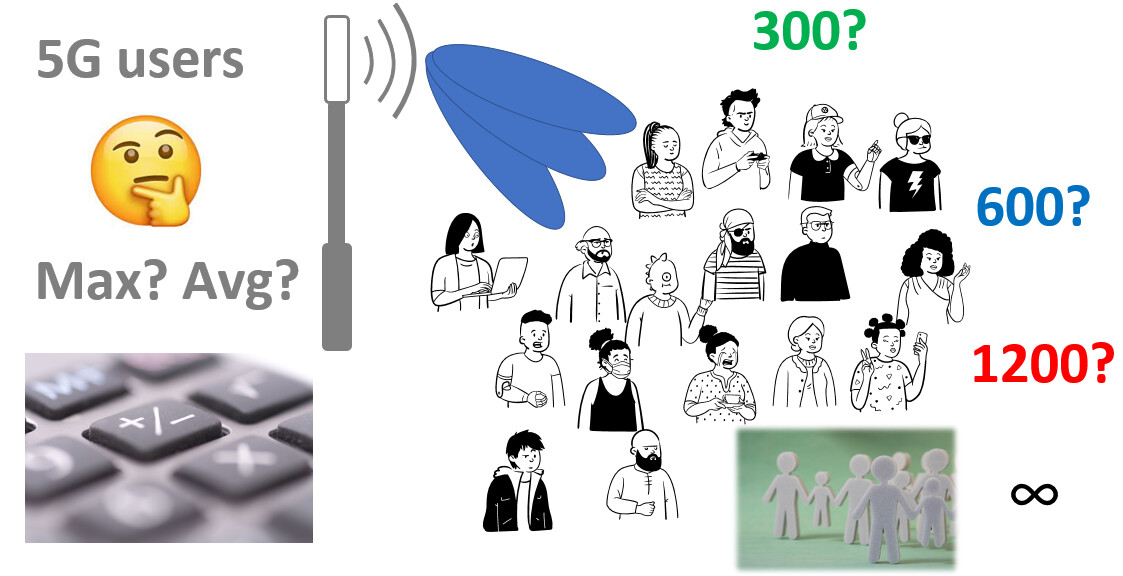
How do 100 users share one 5G cell?
A 5G cell does not provide every connected user with a permanently reserved portion of its total capacity.
The gNB scheduler continuously distributes available time-frequency radio resources among active users.
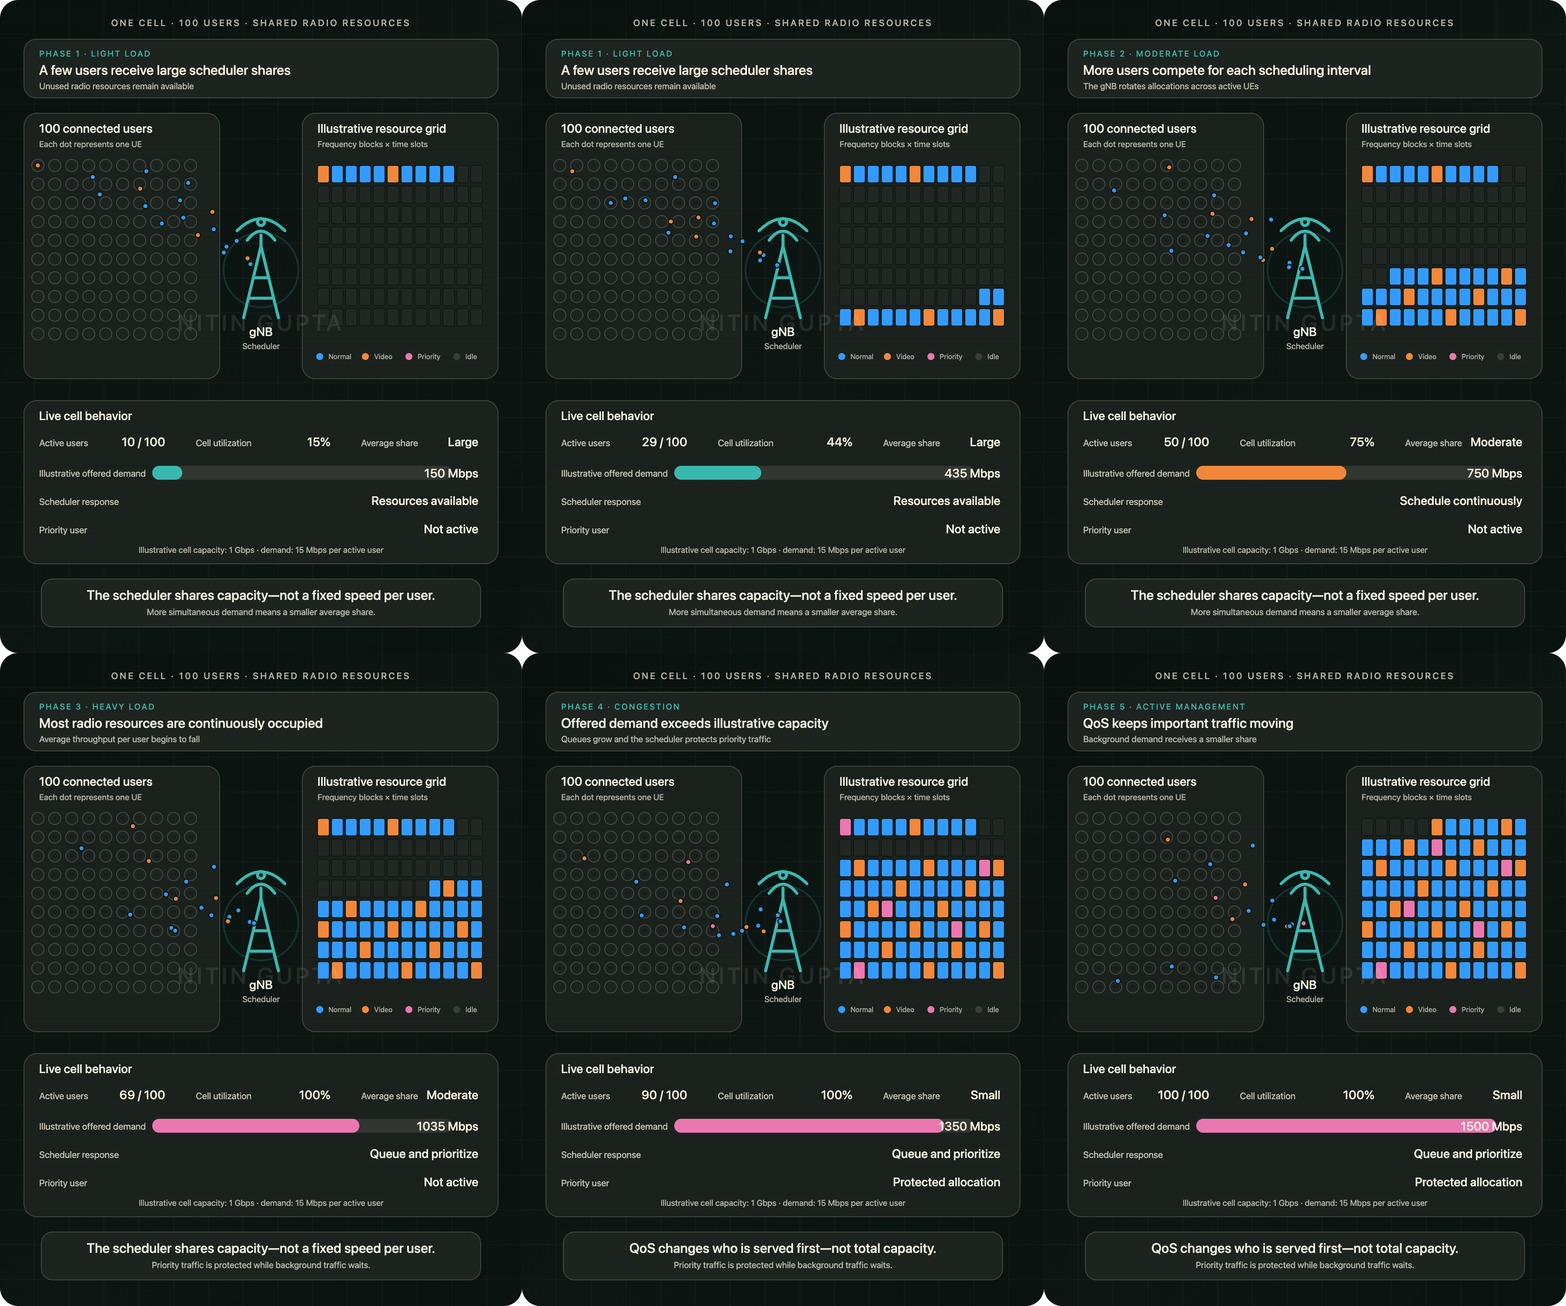
This animation begins with a lightly loaded cell.
Only a few users are active, so each user can receive a relatively large share of the available resources. Some resource blocks remain unused because total demand is below cell capacity.
As more users become active, the scheduler must divide the same radio resources among a larger group.
The animation progresses through five illustrative phases:
- Light load
A small number of users are active. Radio resources remain available, and each user can receive a larger average share.
- Moderate load
More users begin transferring data. The scheduler rotates resource allocations across devices and applications.
- Heavy load
Most time-frequency resources are continuously occupied. Average throughput per user begins to decrease.
- Congestion
Combined offered demand exceeds the illustrative cell capacity. Packets may wait in queues, application throughput may fall, and latency may increase.
- Active QoS management
Priority traffic receives protected scheduling opportunities while lower-priority background traffic receives a smaller or delayed allocation.
The resource grid in the animation represents an illustrative combination of frequency blocks and time slots.
Different colors represent:
• Normal data traffic
• Video traffic
• Priority traffic
• Unused resources
The scheduler’s decisions can depend on several factors:
• Channel quality
• Traffic demand
• QoS requirements
• User priority
• Buffer occupancy
• Retransmissions
• Application type
• Fairness policies
• Available spectrum
• MIMO layers and radio conditions
A user with better radio conditions may transfer more data using the same amount of radio resources because a more efficient modulation and coding scheme may be possible.
A user near the cell edge may require more resources, additional retransmissions, or a more robust coding scheme to deliver the same amount of application data.
The animation uses a simplified model:
Illustrative cell capacity: 1 Gbps
Illustrative demand per active user: 15 Mbps
With 10 active users, combined demand is approximately 150 Mbps.
With 60 active users, demand reaches approximately 900 Mbps.
With 100 active users, offered demand reaches 1.5 Gbps—greater than the illustrative cell capacity.
This does not mean every real 5G cell provides 1 Gbps. Actual capacity depends on spectrum bandwidth, frequency band, MIMO configuration, TDD pattern, interference, radio conditions, transport capacity, device capabilities, and network configuration.
LinkedIn: