Hello Experts.
What are the most importan KPIs to monitor a RAN Network?
Hello Experts.
What are the most importan KPIs to monitor a RAN Network?
Here you can find the most important KPI for LTE Networks:
LTE KPIs Hand Book
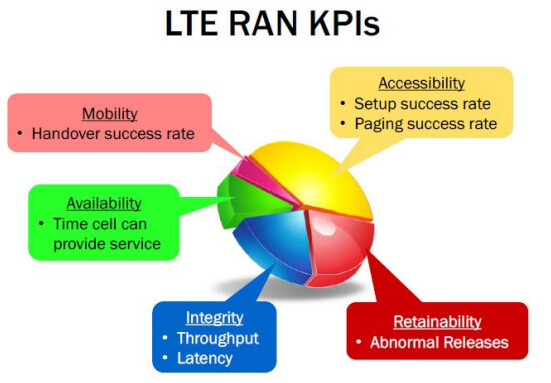
Credits: 
Broadly speaking, there are five basic KPIs that every mobile network operator monitors. Each of these can be drilled down into a myriad of granular KPIs, but what I’ve outlined below are the overarching themes.
The point of monitoring KPIs isn’t to diagnose the problem - it’s to highlight abnormalities.
To use ITIL-speak, “incidents” are deviations from a normal network trend, and problems are the root causes of incidents. Not every incident has an underlying problem, and most problems often manifest as incidents.
The purpose of effective network monitoring is to pick up on incidents (incident management), get the network back to normalcy ASAP (operations management) and then, identify the root cause (problem management).
Here are the five KPIs:
5G Availability, Accessibility, Retainability, Integrity, Mobility.
Visit article for details.
Credits:
Most Important KPIs in 4G LTE & 5G Networks
 Most Important KPIs in 4G LTE & 5G Networks
Network performance isn’t measured by speed alone—it is evaluated using Key Performance Indicators (KPIs) that help engineers monitor coverage, quality, capacity, reliability, and user experience.
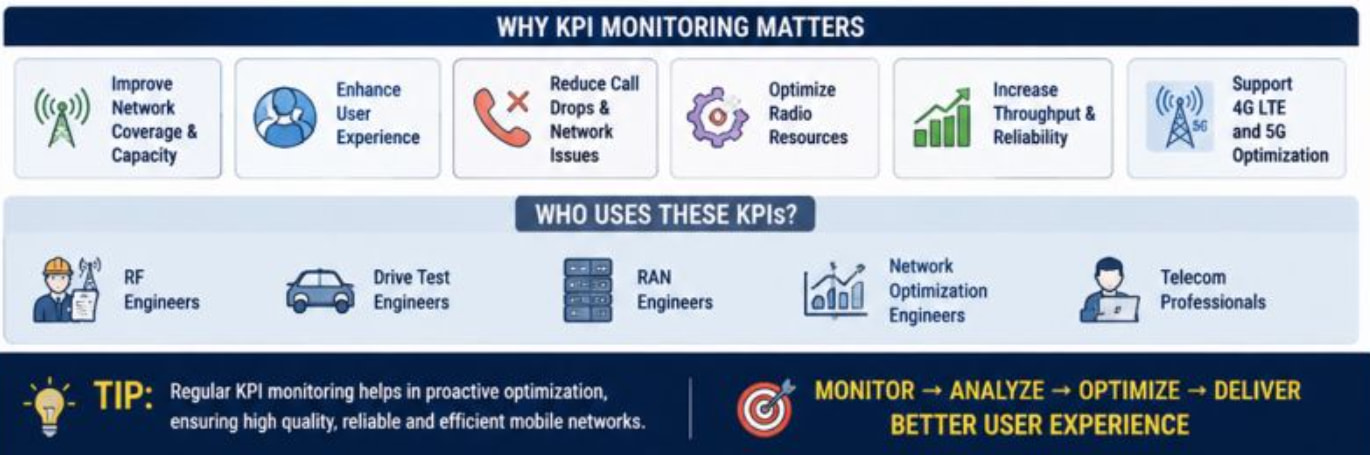
Understanding these KPIs is essential for RF Engineers, Drive Test Engineers, RAN Engineers, Network Optimization Engineers, and Telecom Professionals.
 Key KPIs Covered
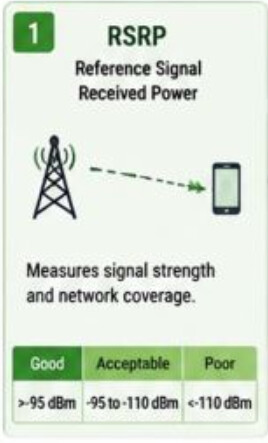
 RSRP – Measures signal strength and network coverage.
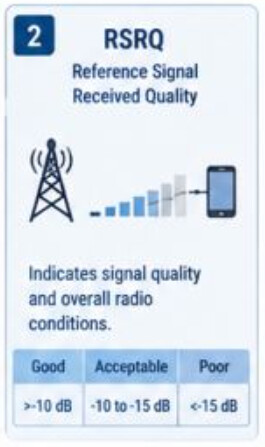
 RSRQ – Indicates signal quality and overall radio conditions.
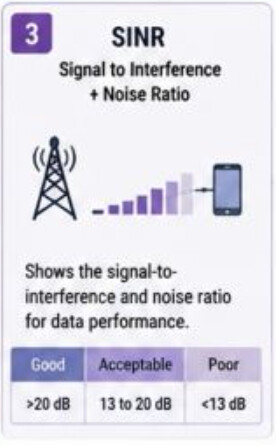
 SINR – Shows the signal-to-interference and noise ratio for data performance.
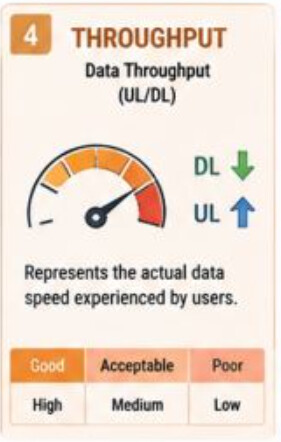
 Throughput – Represents the actual data speed experienced by users.
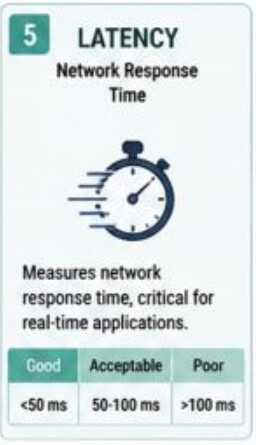
 Latency – Measures network response time, critical for real-time applications.
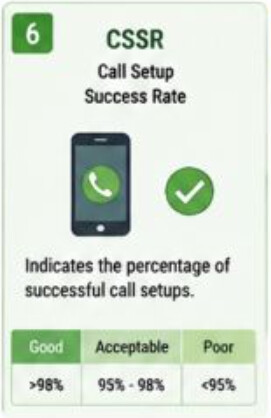
 CSSR – Call Setup Success Rate, indicating successful call establishment.
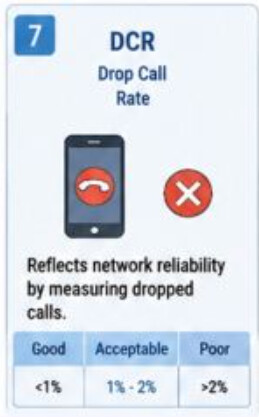
 DCR – Drop Call Rate, reflecting network reliability.
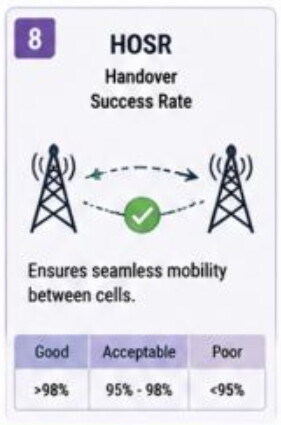
 HOSR – Handover Success Rate, ensuring seamless mobility between cells.
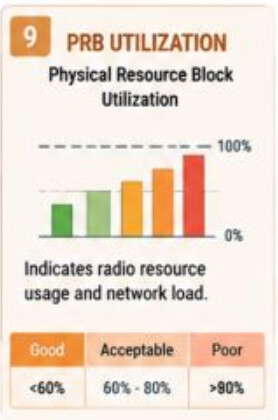
PRB Utilization – Indicates radio resource usage and network load.
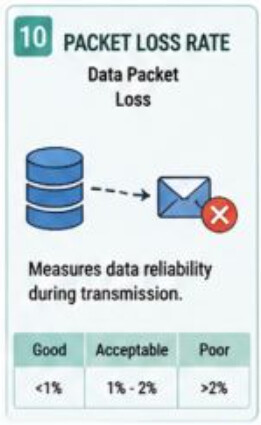
 Packet Loss Rate – Measures data reliability during transmission.
 Why KPI Monitoring Matters
Improve Network Coverage & Capacity
Enhance User Experience
Reduce Call Drops & Network Issues
Optimize Radio Resources
Increase Throughput & Reliability
Support 4G LTE and 5G Network Optimization
Whether you’re preparing for a telecom interview or working in live networks, mastering these KPIs is fundamental to understanding and optimizing mobile network performance.
 Which KPI do you monitor most frequently in your daily work—RSRP, SINR, Throughput, or HOSR? Share your experience in the comments!
Important KPIs are like a health checkup for your RAN network — different KPIs tell you different things, so let me break it into simple categories, this is usually how RAN teams organize their dashboards too.
1. Accessibility KPIs (Can the UE even connect?)
2. Retainability KPIs (Once connected, does it stay connected?)
3. Mobility KPIs (Can users move around without issues?)
4. Throughput/Data KPIs (Is the speed good?)
5. Quality KPIs (Is the signal actually good?)
6. Availability KPI
If you’re dealing with actual drive-test/KPI reports and want to quickly spot which area is weak, there’s a small Excel-upload based KPI analyzer that auto-detects these KPI columns and gives root-cause suggestions — found it useful for this kind of analysis, sharing here:
RF Optimizer KPI Analyzer with Excel Upload