Hello QGIS Experts,
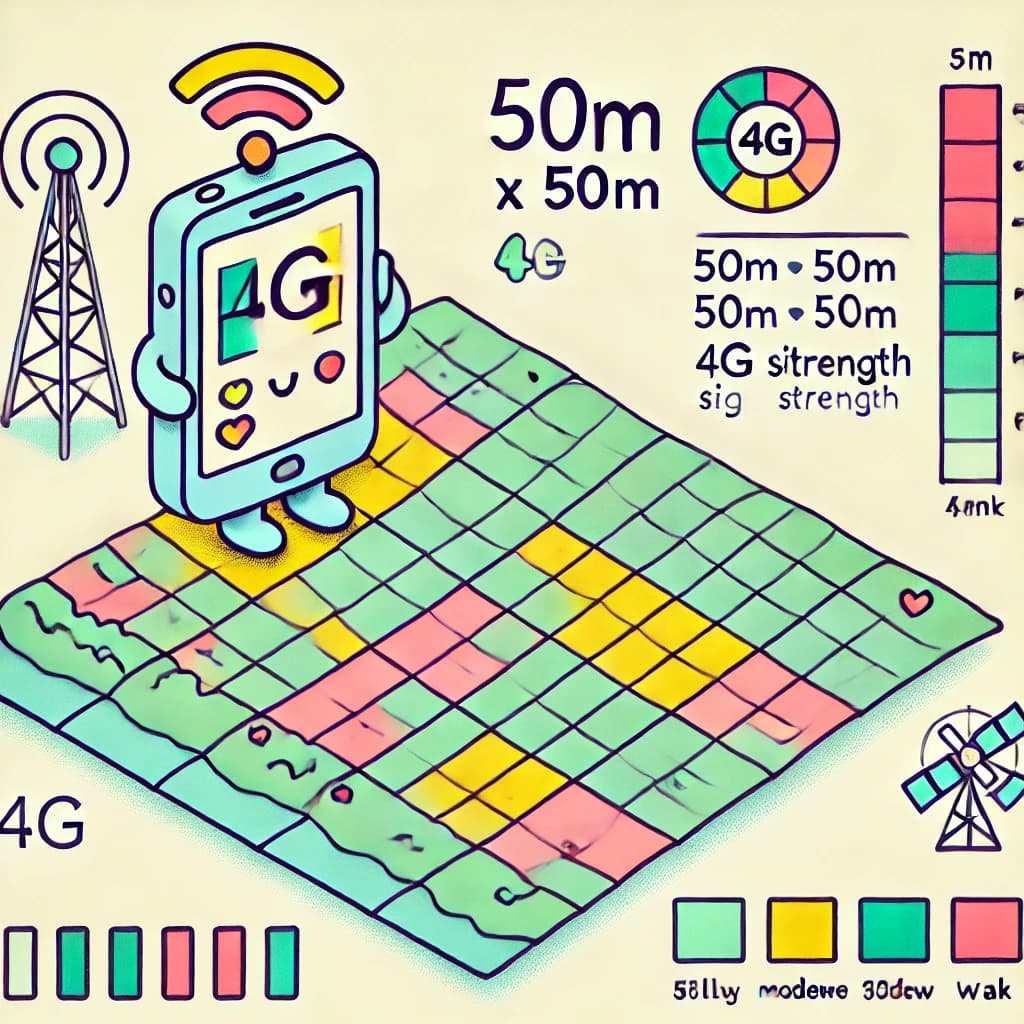
I need help visualizing 4G coverage in QGIS using a 50m x 50m grid. I have sample data containing location coordinates and signal levels.
What steps should I follow to achieve this?
Thanks in advance!
Hello QGIS Experts,
I need help visualizing 4G coverage in QGIS using a 50m x 50m grid. I have sample data containing location coordinates and signal levels.
What steps should I follow to achieve this?
Thanks in advance!
Hello, my friend! Simply convert the vector to a raster.
Here’s how you can do it:
Hi,
First add the data to map, next you create a 50x50 grid on the area you want and then you add the data to the grid using the ‘Join attributes by location (summary)’ tool. It will create a new layer with the grid and the data it has.
There is 2 similar tools, ‘Join attributes by location’ and ‘Join attributes by location (summary)’. The later you can choose what to do with the data in each grid (count, sum, avg, etc), probably is what you want.
And after that you can play with symbology to achieve the results you want.