Yes, but in above figure I didn’t remove last tti.
Why you didn’t?
No special reason.
Just to keep things simple and straight forward
If someone understand the core idea, it’s very easy to include/exclude things.
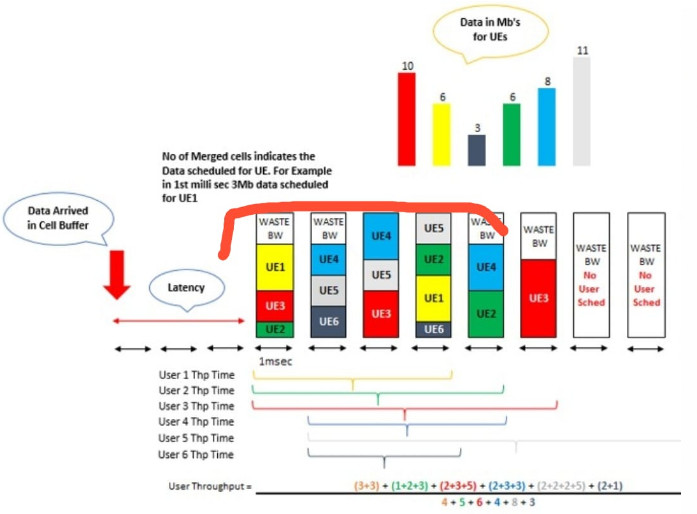
Last TTI thing was catered in this 2nd figure.
Single UE per QCI?
Mean single user throughput will be per TTI?
Is it that different from actual values measured onsite (i.e. through DT)?
Let’s say on the exact same instants and RF conditions?
I didn’t understand how they have calculated overall time used for cell throughput and user throughput calculation…
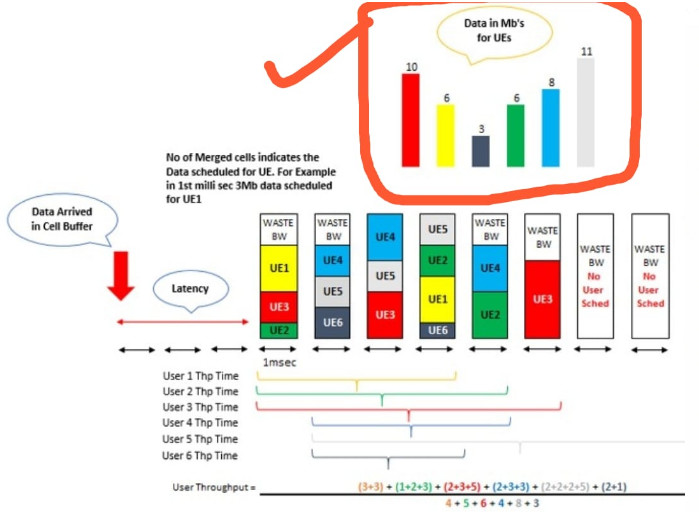
This is the total data which we have to transfer to UEs.
Data is in form of Mega Bits.
For UE1 we have to transfer 10 Mb, for UE2 we have to transfer 6 Mb and so on…
In first msec of scheduling 3 Mb transfer to UE1, 2 Mb transfer to UE3 and 1 Mb transfer to UE2.
One box shows 1 Mb.
For UE1 3 boxes are merged
What’s crateria you select that one UE1 will get 10 Mbps and UE2 to 6 Mb?
There is no criteria.
This is just random values to elaborate the concept.
It’s same like assume X=5.
We have no criteria to say assume X=5. 
I want to understand how they have come up with total time of 30 msec and 12 msec.
Got it Boss. 
Difference in cell and user throughput time is cell throughput time start as soon as data reach cell buffer.
Cell needs some time to schedule it for UEs.
And that time is roughly 3-4 msec.
So total cell time is 3-4 msec + time required by cell to empty the buffer.
So it’s 4 msec + 8 msec = 12 msec.
User throughput time is when data start scheduling for user till the time complete data is transfer that is when buffer for UE is empty.
UE1 took 4 msec so UE1 data divided by UE1 time.
And so on…
I mistakenly took data of UE1 as 6 Mb in example.
Then add data of User 2 in numerator divided by time taken to transmit data [Empty buffer] for user 2 (shown by horizontal arrows).
Green UE scheduled in 3 intervals 1 + 2 + 3 and took total 5 sec to emtpy the buffer so 6 will be added in NUM and 5 in DEN.
And so on.
I didn’t exclude the last TTI to make things simple and easy to understand.
Data reaches cell buffer as shown by big downward red arrow.
How is it 5 msec for Green UE?
UE2 (Green UE) buffer emptied in 5 msec.
So you can see that main difference between user and cell throughput lies in time taken in denominator.
Data in numerator is same.
Separate times for UE is added in denominator instead of flat time duration.
That’s why cell is around 20-22 Mbps and user throughput is around 5-6 Mbps keeping in view data is same for both.
For the sake of convenience you can assume that these boxes things are UE buffers in DL that’s contains data for particular UEs.
Buffer for green UE emptied in 3 intervals of 1Mb+2Mb+3Mb and took total 5msecs
Hope it’s clear now…![]()
2 Likes
For scheduling priority chain is like ue having harq > ue having srb > ue need to have data download then ranking of ue done as C1,C2, C3.
Please tell is it fine as per above diagram.
As I seen gap in scheduling of ue, so it’s seem priority changing in between.
Hi @techieambitious, let’s take these things and keep example easy to understand at the same time  .
.
The whole figure is just to understand the difference.
If we include each and every minor detail it would become very complex to explain and understand.
Yes @AbdurRehman87, but user throughput calculation is vendor specific, so we need to consider these factors. 
But thanks, it’s clear now. 
Yes… The second figure I shown above is for H-vendor.
E-vendor might have its own implementation but definitely vendors included different time counters to make throughput look better.
If the latency part is high, what will be the impact on users?
User experience will be poor.
Any additional further worsen the experience.