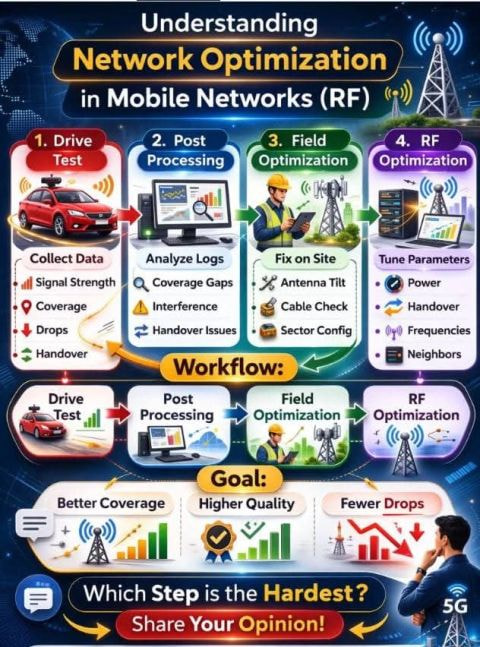
Improving a mobile network isn’t a single task — it’s a step-by-step process that helps engineers find problems and improve service quality. In RF telecom, network optimization usually follows four main steps:
 Drive Test
Engineers collect real network data while moving through the coverage area (usually by car).
This helps measure:
- Signal strength
- Coverage quality
- Call or data drops
- Handover performance between cells
 Post Processing
After the drive test, engineers analyze the collected logs using specialized tools to identify issues such as:
- Coverage gaps
- Interference
- Poor handover performance
 Field Optimization
Once issues are identified, engineers may visit the site to fix physical or configuration problems, such as:
- Adjusting antenna tilt or direction
- Checking cables and connectors
- Correcting sector configurations
 RF Optimization
Finally, engineers fine-tune network parameters to improve performance, including:
- Transmission power
- Handover thresholds
- Frequency planning
- Neighbor cell lists
 Goal:
Goal:
- Better coverage
- Higher network quality
- Fewer dropped calls and sessions
LinkedIn: 
 Discussion:
Which step do you think is the most challenging in network optimization?
1 Like
Post processing is where most wrong diagnoses start. Drive test gives raw data, field work is mostly mechanical, and final RF parameter tuning is usually framed by the vendor anyway. Post processing is the step where one misread can send an entire ticket in the wrong direction.
Three traps I see repeatedly on LTE and NR traces:
- Treating an RSRP drop as pure coverage loss when the actual problem is uplink. Power Headroom Report (PHR MAC CE, TS 36.321) often goes negative before downlink KPIs react, and the UE effectively stops reaching the eNB on UL while DL still looks acceptable on the KPI chart.
- Tagging poor RSRQ as interference when the cell is simply loaded at that time of day. The definition in TS 36.214 is RSRQ equal to N times RSRP divided by E-UTRA carrier RSSI, so it moves with the number of active UEs as much as with actual radio quality. Always cross check with PRB utilization from the OSS before concluding interference.
- Ignoring the SS-RSRP vs CSI-RSRP gap in NR. Both are specified in TS 38.133 section 10.1.6 but they are captured on different beams. SSB beams are wider than CSI-RS beams, especially on FR2, so comparing the two as if they were equivalent can hide a beam management issue that is actually present in the trace.
Before I tag a session as bad coverage in a report, those three cross checks are non negotiable. They filter out a lot of false positives that would otherwise become RF parameter tickets when the real issue was UL limitation, cell loading, or beam management.