Introduction
Here at telecomHall, as you already know, we share tips and interesting suggestions geared to the technical audience, people who works with Telecom and IT.
Today we are going to talk about a very interesting application, but that doesn’t only apply to these professionals, but to everyone that use wireless devices.
Introducing OpenSignal, an application that performs Cellular and Wi-Fi Networks data collection, and use it in building a comprehensive public map with information for all these networks around the World.

And gets it through a technique that should be increasingly exploited in other applications: the collaboration of all users, with beneficial results to all.
Then, let’s go to see the application?
Downloading and Installing
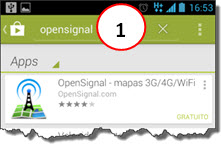
If you have an Android device, to start using OpenSignal simply enter in Google Play and do a search (1). If you are iPhone user, do the same, but in the Market Place.
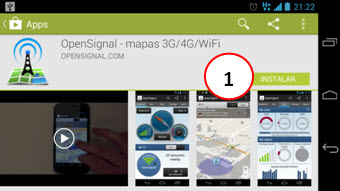
Then download and proceed with the basic installation (1).
Dashboard - Cells
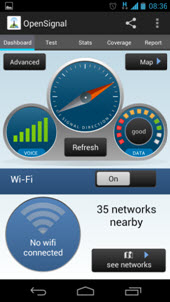
When you run the application on your phone, you have access to a Dashboard, or a set of graphics with the main information. Then we’ll look at each one of the main functions.
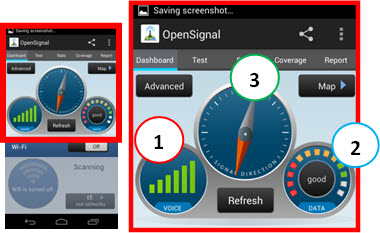
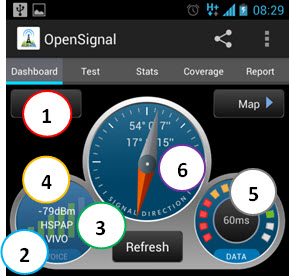
Let’s start with the top of the Dashboard, where you can see 3 circles. The one on the left (1) shows the Voice Signal Quality, the one on the right (2) shows the Data Service Quality and the central (3) shows a compass, whose red arrow points in the direction of the strongest signal (serving cell).
Para informações ainda mais detalhadas, clique na opção ‘Avançado’ (1). Nesse caso, você vê as mesmas informações anteriores, só que com mais detalhes. Por exemplo, podemos ver que para o sinal de Voz estamos sendo atendidos pela operadora VIVO (2), tecnologia HSPA+ (3) e com um sinal de – 79 dBm (4). Além disso vemos que o tempo do ping é de 60 ms (5) e também temos mais detalhes na Bússola (6). For even more detailed information, click on the ‘Advanced’ option (1). In this case, you see the same information as before, but with more details. For example, we can see that for the voice signal we are being served by the operator VIVO (2), with HSPA+ technology (3) and with -79 dBm (4). Also we see that the ping is 60 ms (5) and we have more details on the compass (6).
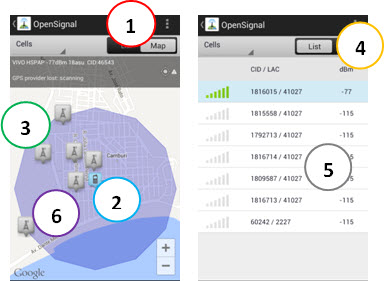
By clicking on the ‘Map’ button (1) we see a map of the region where we are. Our location appears in blue (2), and cells appear in gray (3). By clicking again on the ‘Map’ button (4) you change the view to List Mode (5). And may be then alternating these two ways of viewing.
Dashboard - Wi-Fi
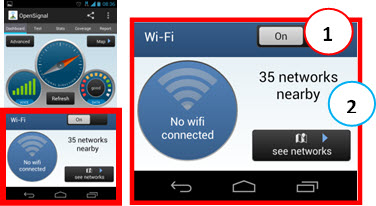
We can also have the option of map above for the Wi-Fi networks. To do this, let’s go back to our Dashboard on the main screen, now at the bottom. Here we can turn on the Wi-Fi in our device (1), and also see all nearby Wi-Fi networks - by clicking the ‘View Networks’ (2).
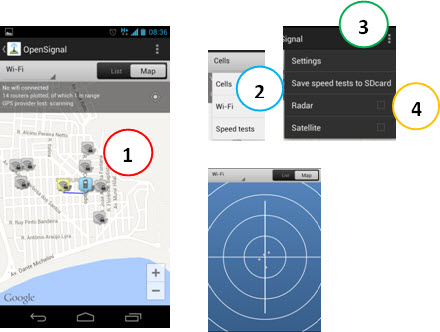
A map appears again, but now with the Wi-Fi AP’s (1). In the same way as for the cells, you can see a list of available AP’s. But another interesting functionality, and which can also be used for cells (2), is the Radar Mode. To access it, click the Options Menu (3), and Radar (4). Note: you can also check the option of satellite images from Google.
Tests
Back to the main screen, we can choose the ‘Test’ Menu (1). Here it is possible to perform tests with our operator, and know how is its Performance. Click on ‘Test’ and wait. As a result we have - among other information - the Ping time (2), Download (3) and Upload Rate (4). And through a range of ‘stars’, we can see how good are Web services, Video and VOIP (5).
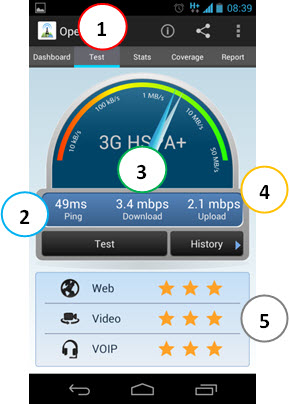
In the example, for the operator that we are using (VIVO), we see an excellent quality for any of these services.
Statistics
Continuing, we have the ‘Statistics’ screen (1).
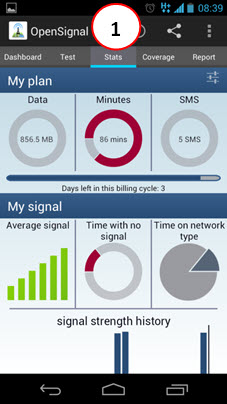
Here it is possible to control a series of measures related to the use of the phone, including the possibility of setting up your specific plan, be it post or prepaid.
Coverage
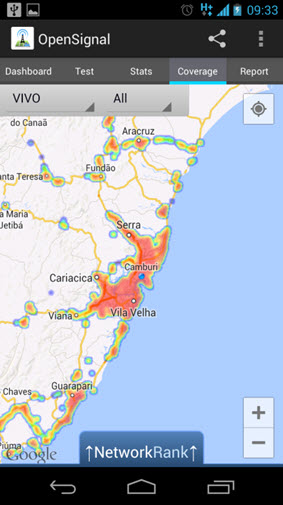
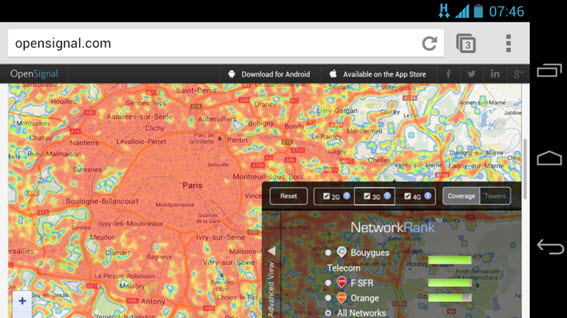
And now one of the most interesting screen, showing coverage through a map with a color range, where the more red, the best the signal strength is.
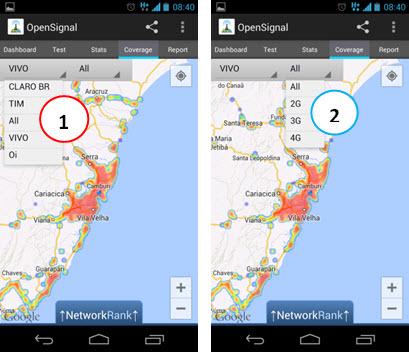
On this map you have several options, as to show only a specific operator (1) or all operators together, and also show only a particular technology (2) or all together.
In addition, you can check the result of a network ranking algorithm (NetworkRank) by clicking on the corresponding link (1), where we have access to a comparative board of all networks around (in this example the networks: VIVO, TIM, CLARO and OI), as well as an overall average of all of them (ALL).
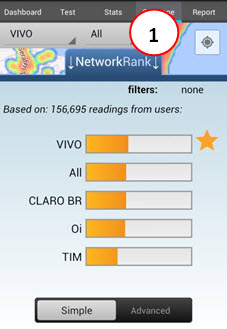
In the case above, we see that VIVO is the best operator in the region (denoted with a star).
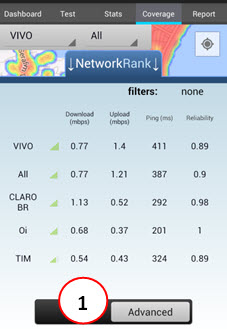
For an even more detailed view, you can click the ‘Advanced’ button (1), and see more details of each network.
Report
Finally, we have the ‘Report’ screen (1), where it is possible to inform some event (Call Drop, Call Blocked, Slow use of Data, etc. ..).
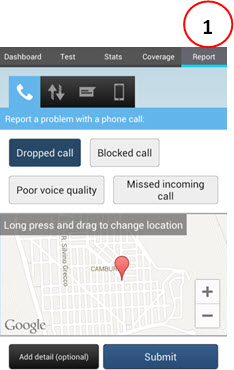
With this, the database ends up having even more additional user information.
Options and settings
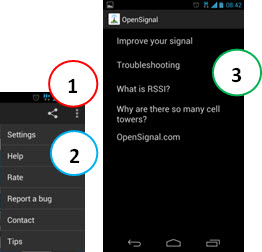
There are still other options and settings that can be accessed through the ‘Main’ Menu (1). By clicking on the ‘Help’ link (2) for example you access the application’s Help (3).
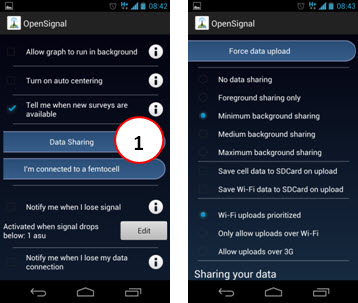
In the ‘Settings’ menu, you can make various settings, as to set if will do (or will not do) the sharing of your anonymous data (1).
Practical Use – Compare Networks
Now that we know the OpenSignal application, let’s see how we can take advantage of it, that is, how can we use the data.
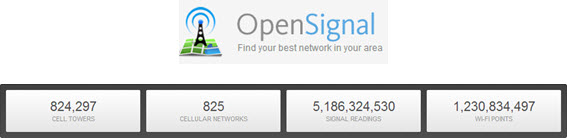
As previously mentioned, the OpenSignal uses the data to create an impartial map, and it can be found at the URL www.opensignal.com. Note: If you want to delve more on the subject, the site provides a free API, allowing you to build any type of custom application, based on public data.
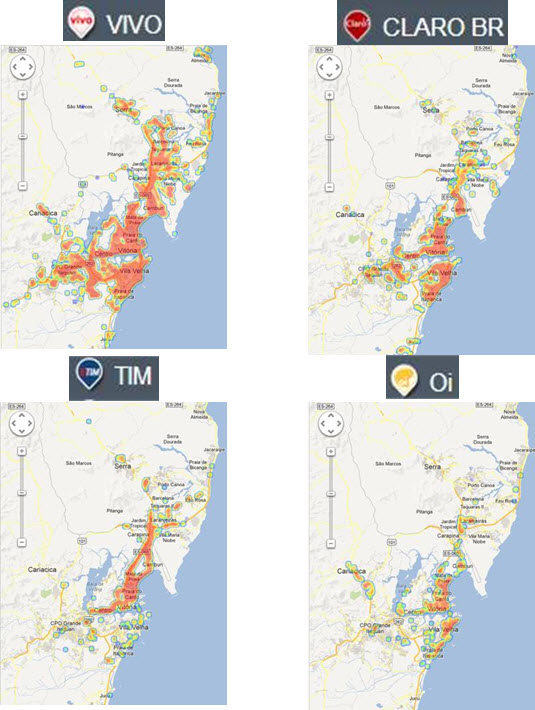
To show a way of use of data, let’s compare the performance for different mobile operators in a specific location. As an example, let’s compare the 3G cellular networks in the region of ‘Grande Vitória - ES’ (which is where we are located).
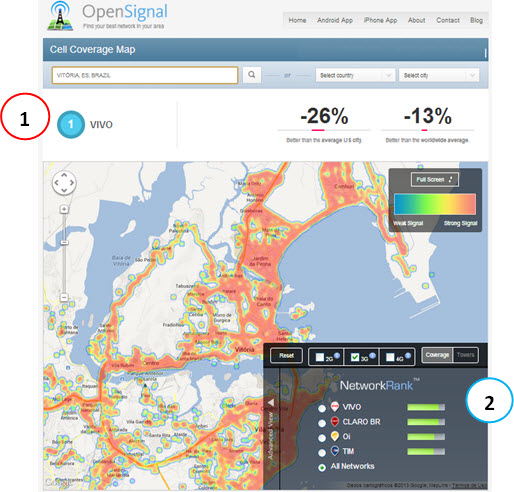
We know that the operators that are present in the area are VIVO, CLARO, TIM and OI. We access the OpenSignal site, go up to our region of interest, either by browsing by map or typing any address. In whatever way, we arrived to the region of Vitória-ES.
As shown in the map, the best operator of the visible region is VIVO (1). The NetworkRank of the region also shows that (2).
By clicking on ‘Advanced View’ option (1), we have more details of each of the networks. The ranking of all the present operators allows you to take your own conclusions (which operator offers the best coverage).
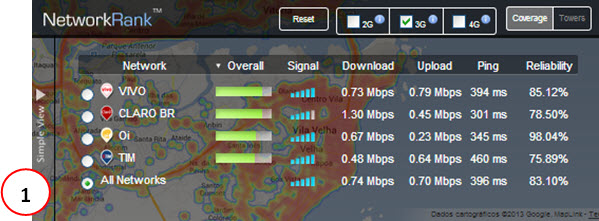
Selecting each one of the operators (in the above analysis were selected ‘All Networks’), we can see the individual coverage map for each one, allowing us to do another type of analysis.
Of course the above comparisons are not as accurate as those obtained through other means, as drive test in each one of those networks.
But serve as a great reference, because the data are collected by the users, and not by the operators, i.e. they are impartial. In addition, we’ve already tested in several places, and the information always matches the reality of the region. For example, in the region that we use as demonstration, VIVO really is the best operator, as can be seen in other reports such as those of Brazil’s telecommunications regulatory agency - ANATEL. (Tip: make yourself the proof in your area!)
This information can be used in several analyses, since Commercial and Marketing as Strategic Planning and Optimizing for your network.
In addition to being useful in Telecom and IT professionals analyses, OpenSignal grows every day, and is increasingly becoming reference to those who wish to acquire a new operator service. In this case, the ‘best operator in the region’ will be pointed in the results shown here, and surely it is worthy that operators ensure a good result for their potential future clients!
Another way of use…
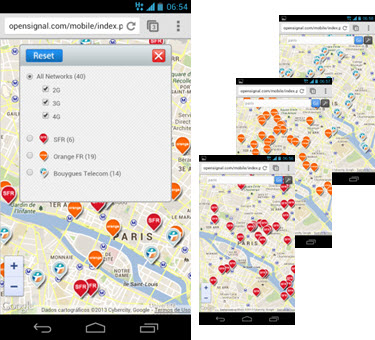
In addition to the advantages that we have seen above, OpenSignal still has an interesting application. Have you ever had questions of what are the major operators of a particular country? Well, just use your OpenSignal, navigate to where you want to, and find out!
In the following example, there are the major carriers of Paris, France.
And now we can say that the main cellular operators are Orange France (France Telecom), SFR (originally Société Française de Radiotéléphonie) and Bouygues Telecom.
Conclusion
OpenSignal is an application that can measure and record information of any Cellular or Wi-Fi network where the device is connected.
Through the collaboration of thousands of users around the world, it was created and is continually updated a public database with information for all operators in detailed reports, including Maps. In this way, it became one of the largest independent sources of Performance and Coverage of Cellular Operators information.
This information is useful in several cases, such as for a person wishing to know in practice how is some operator’s performance at area on which he wants to acquire any plans, and also so that the operators can have an insight into the areas that require greater attention and investment.
We hope you enjoyed. And until our next tutorial.