This February, I built a 5G DL Throughput Benchmark for 100 hotspots using QGIS — and here’s the workflow that made it possible:
![]() Grid Creation — Defined uniform measurement zones across all hotspots
Grid Creation — Defined uniform measurement zones across all hotspots
![]() Voronoi Polygons — Mapped each hotspot’s coverage influence area
Voronoi Polygons — Mapped each hotspot’s coverage influence area
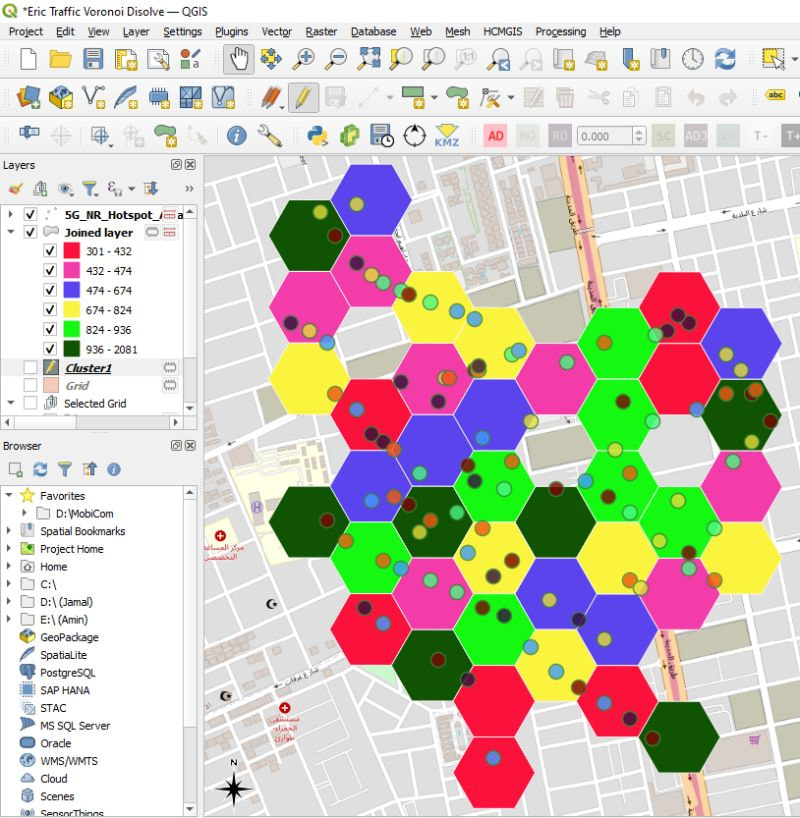
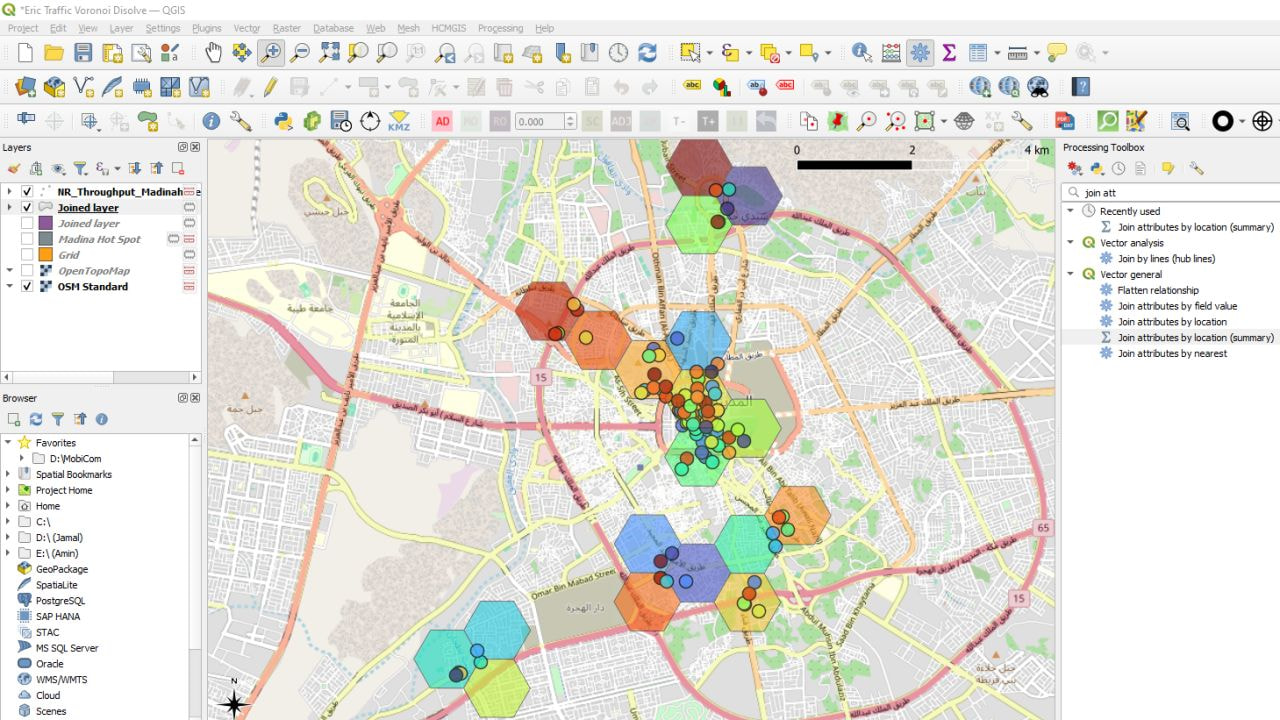
![]() Join Attributes — Attached DL throughput KPIs to each polygon
Join Attributes — Attached DL throughput KPIs to each polygon
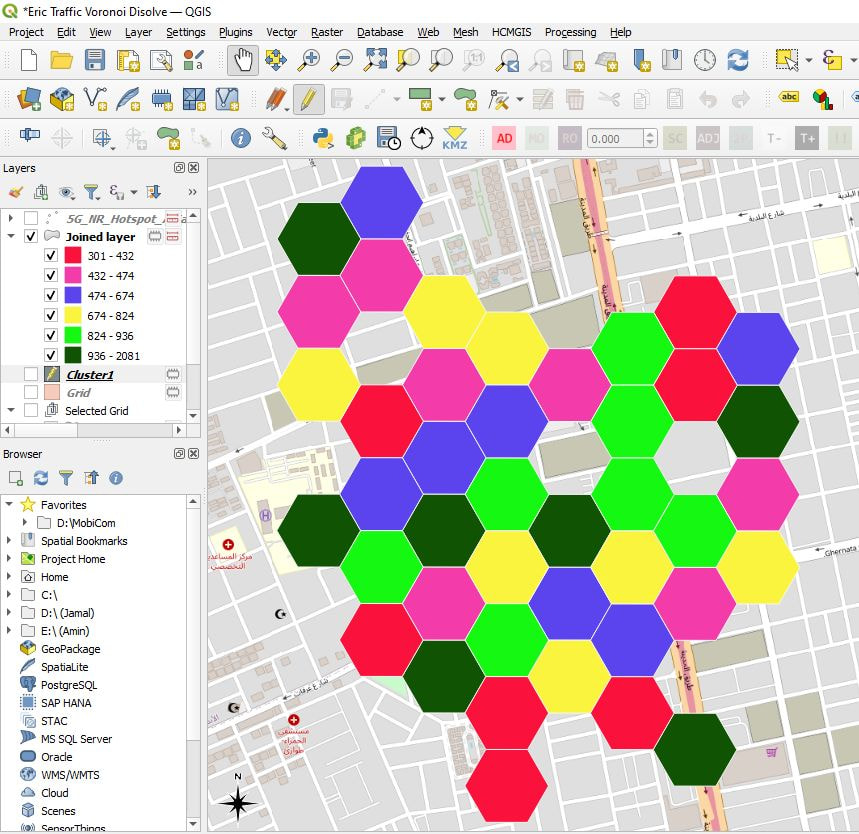
![]() Dissolve — Grouped zones by performance level
Dissolve — Grouped zones by performance level
![]() Polygon Difference — Highlighted exactly where improvements occurred after optimization
Polygon Difference — Highlighted exactly where improvements occurred after optimization
The result: a clear, map-based before & after view of 5G DL Throughput improvements — no guesswork, just spatial proof. ![]()
LinkedIn: ![]()