Hello, everyone.
Welcome to this exciting Power BI journey, packed with insights! Whether you’re embarking on your first data analytics adventure or looking to elevate your skills, you’ve come to the right place. This tailored experience is designed to make generating valuable insights in any domain easy and quick.
The Power BI series will unfold across two videos, delving into the most crucial techniques in Power BI. Following that, there will be two additional practical videos where I’ll construct two distinct KPIs and another Insight template. These templates can serve as a valuable reference, solidifying the knowledge you will gain from this YouTube series.
Below is the content covered in Part 1:
- RF Use Cases & Basics
- Why Power Bi?
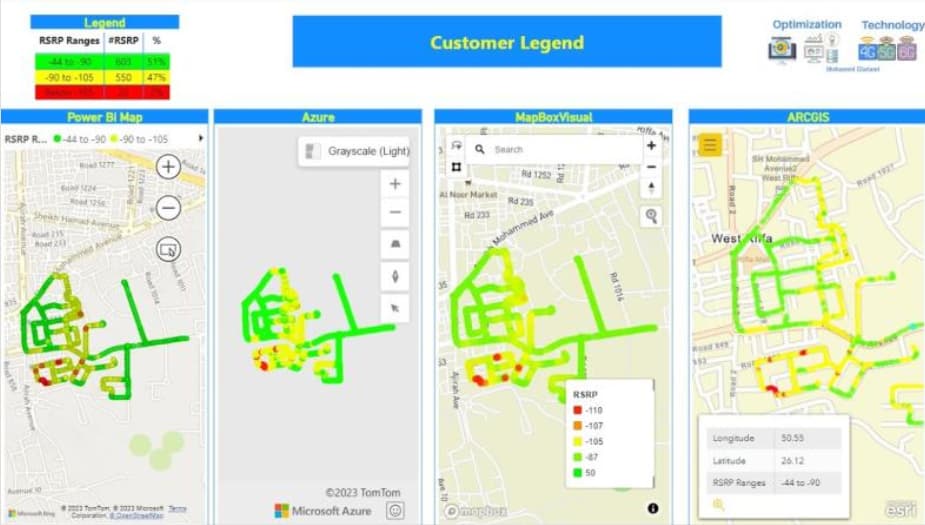
- Examples of Crowd Sourcing Insights and KPIs Dashboard
- Power Bi Main pages Overview
- How to create a Visual
- Visual Creation & Formatting
- How to upload datasets
-
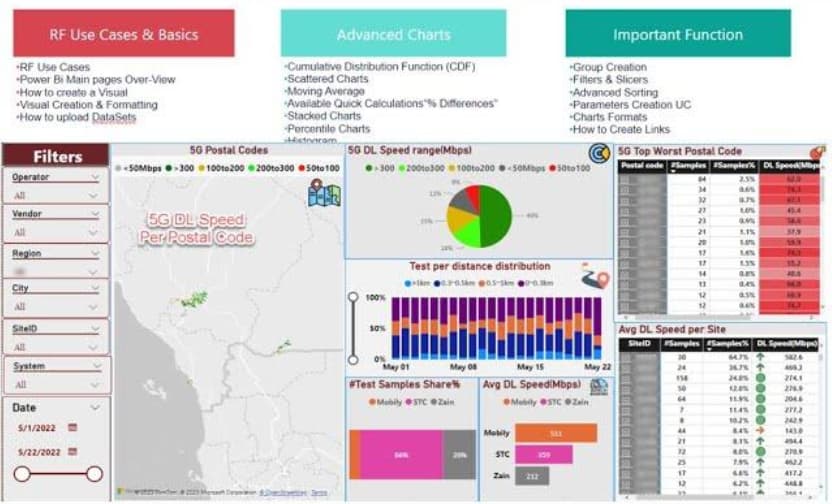
Advanced Charts
- Stacked Charts
- Histogram
- Available Quick Calculations”% Differences”
- Scattered Charts
- Percentile Charts
- Tables
- Moving Average
- Cumulative Distribution Function (CDF)
-
Important Function
- Group Creation
- Filters & Slicers
- Advanced Sorting
- Parameters Creation Use Cases
- Charts Formats
- How to Create Links
-
CDF Formula:
CALCULATE(COUNT([KPI]), FILTER(ALLSELECTED([BINS]), [(BINS)]<= MAX([(BINS)])))
/ CALCULATE(COUNT([KPI]), ALL(BINS])) -
Moving Average Formula:
AVERAGEX(DATESBETWEEN([Date] , MAX([Date]) - 4 , MAX([Date])), CALCULATE(AVERAGE([KPI])))
LinkedIn: ![]() : Mohamed ElAdawi Ashour on LinkedIn: Mastering PowerBI: Unleashing Insights from Basics to Pro (Part1/2)
: Mohamed ElAdawi Ashour on LinkedIn: Mastering PowerBI: Unleashing Insights from Basics to Pro (Part1/2)
Watch on Youtube: ![]() https://www.youtube.com/watch?v=KmAOfUeRo2Q
https://www.youtube.com/watch?v=KmAOfUeRo2Q
Video Script: (HH: MM)
Introduction 00:00 to 00:02
Min - RF Use Cases Examples 00:02 to 00:05
Power Basics: 00:05 to 00:20
Advanced Charts: 00:20 to 01:15
Important Function: 1:15 to 02:00