L.Traffic.UL.SCH.QPSK.TB counter has increased lot and impacted UL Throughput in one cell only

Dear Experts,

Why the L.Traffic.UL.SCH.QPSK.TB counter has increased lot and impacted UL throughput in one cell only?

All other cells in site is working fine without any issues.
Also there is no step change in Uplink interference too.
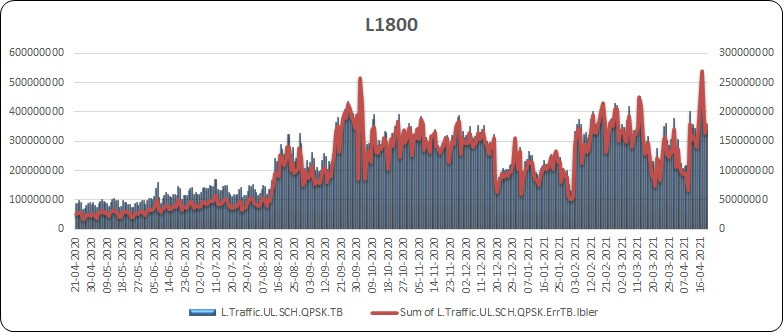
Since this counter increased over all user throughput got decreased in the site.
L.Traffic.UL.SCH.QPSK.TB.Retrans - This counter also increased since the same time.

Vendor is Huawei.

Any suggestion?

Check changes for neighbouring cells.
Like tilt, azimuth, power.
It seems now your cell grabs more traffic from poor RF.

There is no traffic pattern changes in neighbour cells…

What is another explanation is that you have more traffic from deep indoor with QPSK.

Look what other value has decreased in meantime: 256 qam or 64 qam or 16 qam.

I have doubt, why it affects only UL Throughput not DL Throughput?

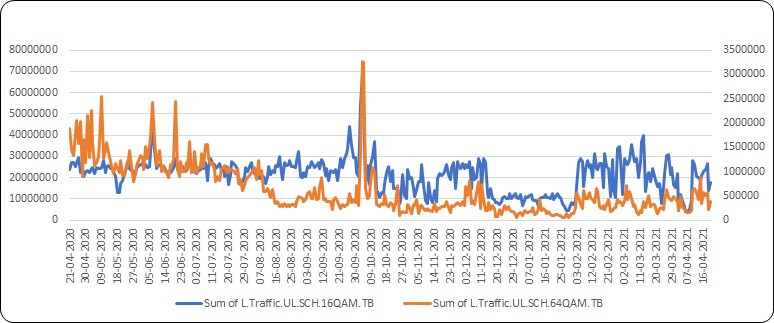
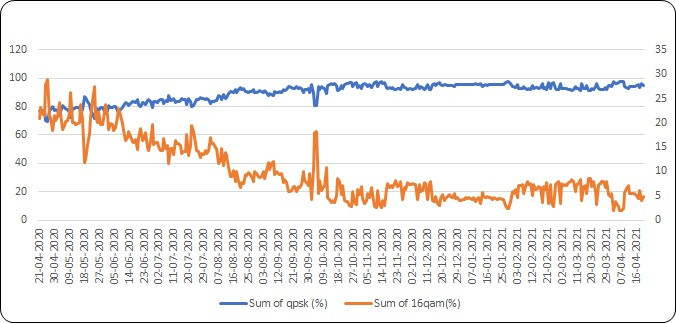
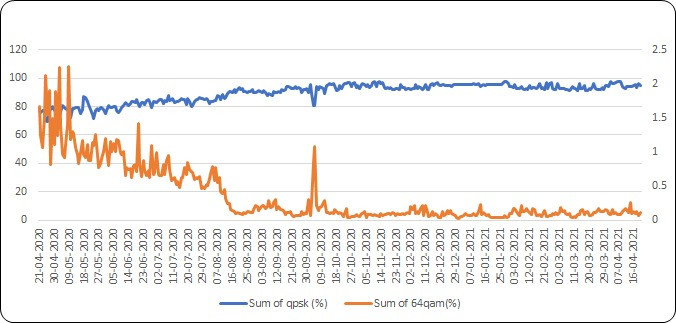
For this you have to analyze % of each qam.
Keep in mind that in UL antenna pattern ( of ue) is very much like omni whereas in DL (of enodeB) is very directive.
So there is much more interference in UL.
Check the counters NI noise and interference to see any change.
Max and avg for UL.
Like those ones:

L.UL.Interference.Avg.PRBx (Average interference and noise received by PRB x in a cell), where x is PRB from 0 to 273.

It seems 64QAM has decreased at the same time.
16 QAM has no problem.

So you see, there is a balance, traffic shifted in weaker RF.
But you cannot conclude on this graph alone.

Don’t count samples, count % of samples.
There you will have a better view.

Checking these counters further.

Like this qpsk/(qpsk+16qam+64qam+256qam).
This way is much better.
And same for 16qam/(qpsk+16qam+64qam+256qam).
And for 64qam/(qpsk+16qam+64qam+256qam).

Put all 4 percentages in a graph and you will have a clearer view of what is going on.

Thanks, got it! :+1:

Good suggestion @RFSpecialist!
If doing comparisons, % is generally a better way to do it since it normalises stats.

My guess is that someone changed HO parameters or did some other optimisation which is causing site to pick poor RF users.

Please check below

  1. UL RSSI value
  2. UL SINR PUSCH
  3. UL BLER as well parallely

Above poor values can be due to increase in users on nearby cell injecting noise.

Calculated value and see QPSK (%) has increased.

image

image

Let me check HO parameters, there is no changes done in site during that period.

I can see UL IBLER has increased at the same time.

Ok, then quite possible for noise.
Please try for neighbour cell coverage reduction.
Check for ultargetbler parameter,TA samples, any new site integrated in area.

UL IBLER is effect of change, not the cause.

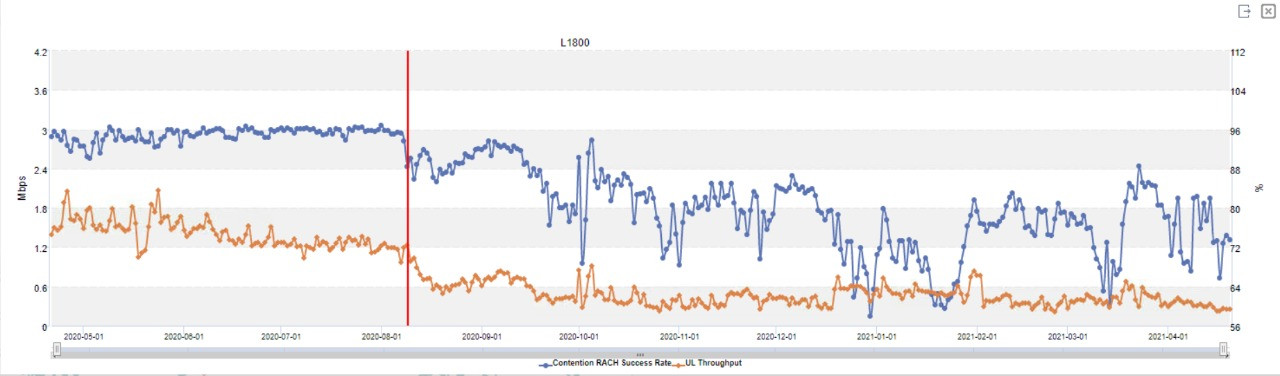
It seems degradation happened gradually between 21/04 - 16/08 and then stabilised.
That is very long period for affect of parameter or physical optimisation (you can see affects literally from hour of change).

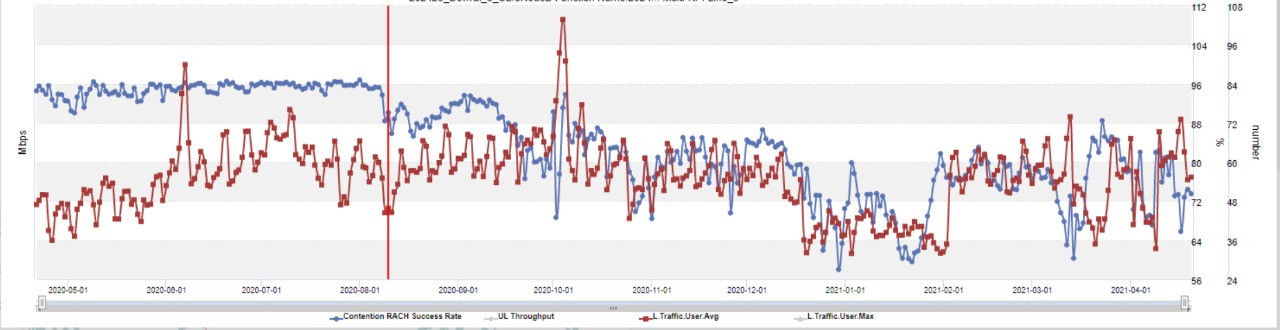
Plot number of users on same graph and see the trend. If users are increasing in same time window (21/04 - 16/08) it means more customers are coming up in your area and they are largely in poor RF conditions. You need to improve their RF condition in order to improve performance.

We can see Contention RACH SR also degraded.

Again this effect of change, not cause.
Can you please show absolute number of users?
Pick RRC connected users.