Interpret Drive Test data in a chart

Hello.
I have done some drive test (4G) doing some DL speedtest every 30 sec.
Versus competitors.
I have graphs for RSRP/RSRQ/SINR/CQI vs throughput.
Can anyone help me interpret the data?

image

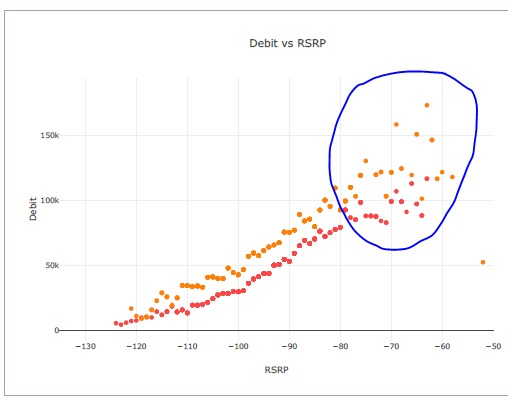
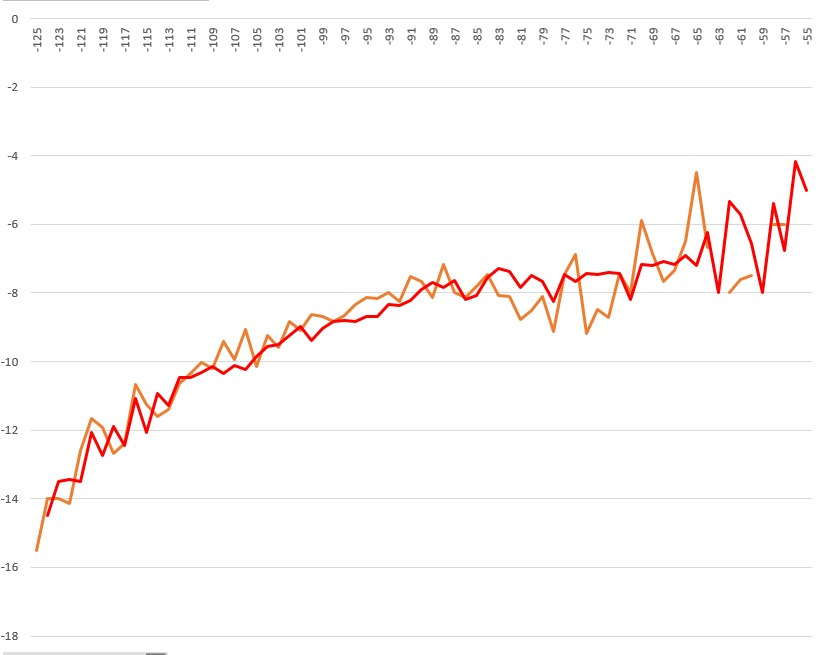
For example, when in very good coverage, competitor (in orange) has better throughput than me (in red).
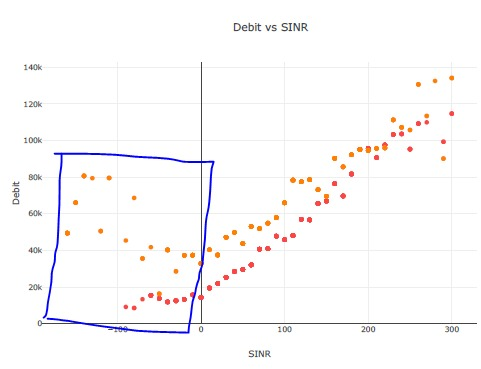
In poor SINR, competitor has better than me.

image

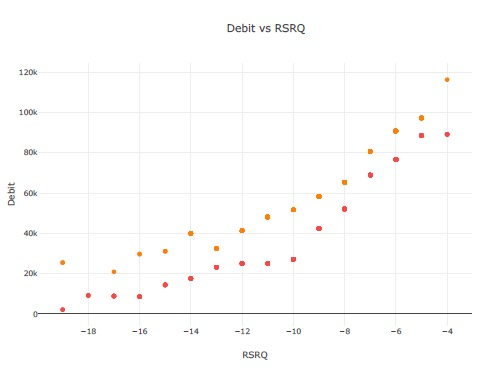
For RSRQ, I can see that competitor always has better throughput; can i say that competitor has less traffic (since better RSRQ)?
image

For load check allocated PRBs on PDSCH.

Generaly that means yes.
But also maybe has higher ISD or/and better Optimized network in terms of cell overlapping.

I do not have these stats.
Its some speedtest + homemade tools to capture android radio info (on basic samsung phone).
It does not give RB allocated, etc…

I need to check the RSRP vs RSRQ.

Also check SINR if you have this metric available.

This is RSRP vs SINR.

Same for RSRP vs RSRQ.

In order to figure out if it is load or cell overlaping I sugest to compare % of cells within 6dB RSRP window of your network and competitor.
That will tell you if planning and optimization is OK.
If similar than we can say it is up to the traffic load.

Not sure if I understand…
Do I need to check average RSRP per cell, then compare RSRQ and throughput for cells that are within 6 db gap?

Take serving cell and count for every measurement what is number of measured cells within 6 dB by RSRP.
RSRPserv - RSRPmeasured < 6 dB

Ah, OK.
I check serving vs 1st neighbor for me and operator;
The operator having more “overlap” will have poor network design.

Is this for a particular band of LTE or for all LTE layers of operator combined & the BW?

It’s for all band, with CA.
One point: we don’t have same bandwidth. We have 15 MHz on L18 and L26 and they have 20 MHz on both.

That is a major point.
You can’t compare.

You have your answer buddy…

But I need to compare and get a baseline, then i can do optimisation to get it better.

Plot these things bro… it will help you out:

  1. Plot RSRP on x-axes with RSRQ on y-axes in single graph for both your operator and competitor…
  2. Plot throughput per PRB against RSRQ.

Secondly compare your BW and Power settings with competitor.