For years, I jumped between Spotfire, Excel and a map to answer one simple question: what is wrong with this cell?
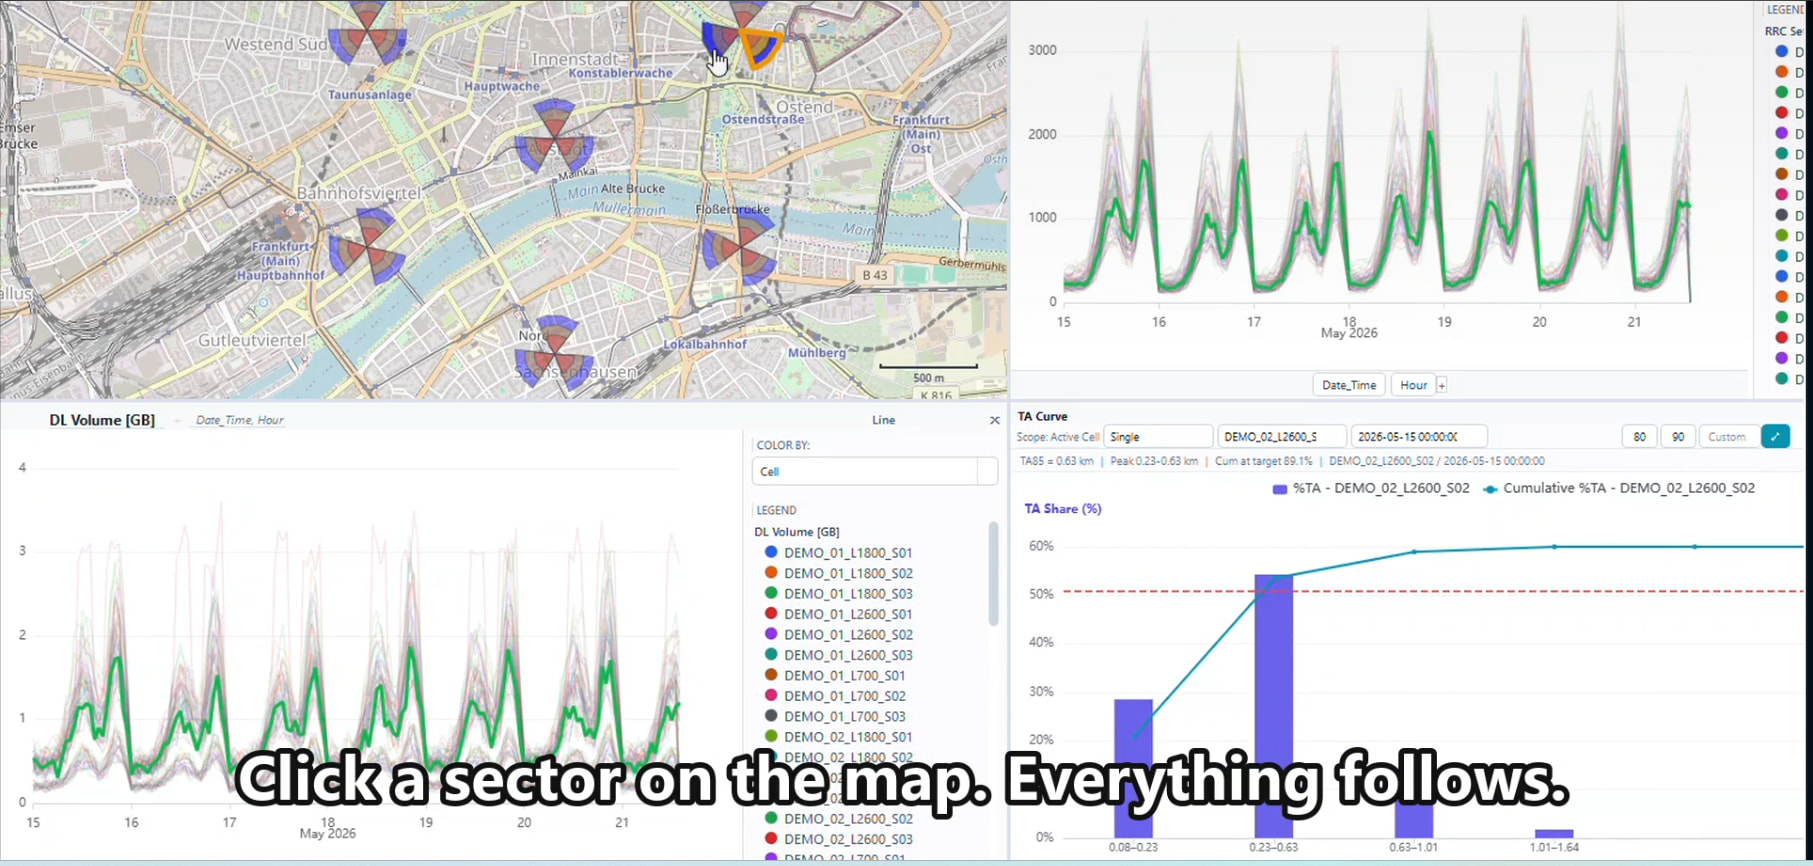
AI tools are very good now, so I tried to build my own tool. This is Tofreq. It shows hourly KPI, the cell map and Timing Advance together. When I click a cell on the chart, the map shows the sector. When I click the map, the charts change too.
It works, but it is not finished. I am not sure what to do next. Should it be a web app or a desktop app? Or should I stop here for now?
I made it with Python, DuckDB, PyQt6, ECharts and Leaflet. The KPI and map data in the video are only test data.
I also made a new personal website. It has some simple RF tools that I use myself.
The link is here
LinkedIn: 