Introduction
Network Performance Monitoring is certainly one of the most important activity in the daily work for all people involved. So we’re beginning today several tutorials related to Performance / KPI, this big challenge, whatever the area of Telecom & IT.
When we improve the Performance, we also improved customer satisfaction - reducing its complaints. In addition, we maximize revenue (fewer drops, fewer blockages, fewer failures: more calls, more quality, more revenue).
When we have an optimized network scenario, we can for example cover a particular region with a minimum of elements (BTS, antennas, etc. …). The opposite: a scenario without this concern to Performance optimization - requires greater spending on CAPEX and OPEX.
CAPEX increase because, without adequate analysis, unnecessary equipment will be inserted in the network. And OPEX: if there is no action, increases with the increase of the network.
There are numerous advantages to get - and maintain - a network optimized. So let’s see what we can do to achieve it!
Note: In some previous tutorials, we’ve covered some important concepts about Performance and KPI. Although now we are more focused on practical applications, it is highly recommended that you read these tutorials before proceeding.
Traditional Methods and Tools for Performance Analysis
There is a huge amount of commercial tools currently available for the purpose of Performance and KPI Analysis. In addition, many operators have developed their own systems, such as Queries and Charts on Intranet.
Some of these tools also include BI - Business Intelligence - that is, attempt to insert intelligent algorithms that can do the analysis for us, or at least present the relevant data only.
But the need for a better method of analysis, besides being an important task, is very particular to each individual. There are people who prefer to analyze the data in Top N tables. Others prefer do analysis using only Charts. While others through the identification of variation in profile (delta).
But for whatever type of analysis, they rely on a data system that provides the best possible way.
Analysis System and KPI’s
When we think of creating any Analysis System, we must, before anything, define which parameters should be monitored and evaluated.
In our case, it’s called KPI, and to any cellular network, the main KPIs are:
-
Traffic
-
Call Drop
-
Call Blocking
-
Establishment
-
Handover
The KPIs - Key Performance Indicators are then those values (Indicators) that allow a full view of the system: if the network is good or bad!
After having defined the KPIs, analysis can begin.
If one (or more) of these Indicators are bad, some real problem is happening - and some action must be taken.
Although there are typical values of KPI, there is not an optimal value. That’s because they are very specific to each particular network. But this is a subject we cover in more detail and examples soon. Today we only need to know the basis of any such system.
Counters
If we consider building a system from scratch, it really looks hard. But believe: it isn’t. You can follow here the development of each step, always by examples. In the end, we are sure will be surprised with the system you will create together.
And now let’s start from the bottom: the counters.
A cellular network consists of a set of elements (Cellphones, BTS, antennas, etc …) that carry a lot of events (Registers, originations, terminations, etc. …).
All these events are stored in a computer (for example, the BSC consists of a computer, which among other tasks, stores the counters of the events and information between BTS and Mobile) in the form of files and / or tables (databases).
These computers are linked to elements of the system (BSC, HLR, etc …) are in turn connected to a central computer / server, which searches all information of each of these elements.
Metrics
Ok, the raw counters are important, and some of it already represent its corresponding Indicator.
But in most cases, we need to use / define metrics (or formulas) that translate the raw counters in KPI’s or any other Indicator.
Each vendor has a proper documentation stating which counters make up each KPI’s and other complementary Indicators.
After this brief introduction to these basics ok Counters and KPI, let’s continue. Today we will see how to prepare the basis of any Analysis System: the treatment (parsing) and import of counters to a database.
Overview of Performance Analysis
The Performance Analysis of a generic form, can be divided in several steps or procedures. Each of these steps may have some variations, follow certain periodicities (repetitions), etc… But in general follow a simple script.
- Collection of Raw Data (Performance Counters).
First, collect the counter data for the network, from the management systems (OSS). Through a program (Client) we can define what counters we want, to which elements, time, etc… With these settings - which are stored in templates for new OSS future queries - we can export them to our computer (local directory).
Note: The OSS also allow metrics to be defined (formulas), and we also have some basic analysis available, including charts. This is good, no doubt, especially for quick analysis. But our goal is to build a system that do this ‘also’; but go much further, using “intelligence” (algorithms) to do a more thorough and comprehensive Analysis. In addition, our system can integrate data from our Performance with other databases such as Network (cells, antennas, etc …) and Parameters, with a much greater range of views, such as Mapinfo and Google Earth, among other modules.
CHECKPOINT: We have then the counters periodically downloaded to a local directory on your computer. For now, manually.
- Applying Metrics, Getting Indicators.
From raw counters then we start to get the Indicators through the metrics.
For example, our file can have a counter ‘kxy13’ with the traffic information to our cells. This case is a straightforward and easy to understand. TRAF = kxy13.
But there are other Indicators, which are far more complex, and their metrics can involve additions and subtractions of various counters in both the numerator and denominator. In a fictitious example: HO% = 100 * (kjh11 + kjh45 - lkj23) / (htr34 + jju12).
Note: we are not concerned with these issues today. Not as Indicators. Soon we will explain how to do everything in very simple way - with nothing but organization.
CHECKPOINT: We have for example an Excel spreadsheet, with key Indicators necessary for an analysis.
- Analysis
Well, with all Indicators available, we only need to ‘analyze’.
Although a simple word, involves many possibilities. It also includes several other factors, such as how each individual has it’s own way - the way he ‘likes’ to analyze, as we said before.
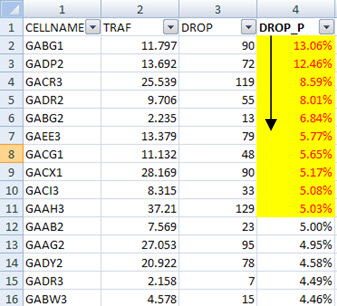
One of the most common practices is to sort each Indicator (Descendant, Ascending), and begin to act in the main ‘offenders’.
For example, in a table cell for a given period, we sort by the ‘rate of dropped calls’. And then, get the Top N, and trigger more specific findings or analysis (physical configuration, alarms, configuration parameters such as handover, etc…).
For each cell we can generate specific charts for offending cells, such as Traffic. Drops, Blocks (congestion) and Handover. Yes, That helps.
We can create some metrics involving Indicators, for example Traffic + Drops + Blocks, and do the same checks listed above.
Besides all this, we need to pay attention to some other factors, for example: ‘When analyzing dropped calls, should we use the percentage or absolute number of drops?’.
If all this were not enough, we have to repeat the above process periodically, at least every day!
Can we work this way? Yes! Many operators, despite all the developments and tools available, still use this way when analysing.
And can we improve this way? Also: Yes!
We can have it all in a few seconds: the automatic analysis of all elements of our network, sent via e-mail, SMS, Mapinfo and Google Earth plots, Graphics, etc… See for example, a a sample of Hunter Dashboard.
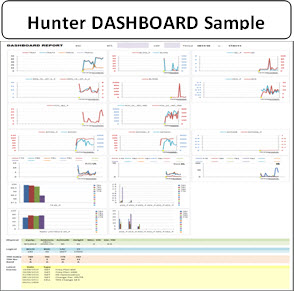
And that is our goal, to seek a more simple, fast and smart way of doing the analysis! You will be amazed at what can be done, and how the improvements will be observable on your network, as soon as you start to work this way.
For this, we define the Hunter methodology. It involves all those processes that enable excellence in the analysis of the network as a whole.
Let’s go and simulate all possible scenarios, all the necessary tests. But most important: Nothing else! It is also our goal to avoid rework, due to an inefficient approach.
All the tutorials contains dummy data where you can practice and easily adapt to your scenario.
So, without further general introductions, let’s turn our attention to the subject of today’s tutorial, which is the first step: store daily counters in a database table.
Observation
It is worth remembering the following: our goal is not to ‘replace’ any current system or tool, developed by both commercial and your own company, such as intranet portals. While this may eventually happen, the idea is to work together with these tools.
But it is clear that a tool that you have total control and can do all kinds of use you want, it is very interesting and advantageous. So, you decide the way you’ll be using it!
Goal
Present the solution to the module ‘Hunter Performance - KPI Counter Parser and Importer’.
Scenario
To begin, let’s set the scenario today. As always, our dummy data are very close to all the existing vendors, allowing you to practice, and then apply in your specific network later.
Note: For help on how to set the counters, and how to download it for existing vendors, please contact us.
In our example, we download data from all cells ‘GSM’, using the ‘OSS’ Client software for ‘VendorX’ in ‘CSV’ (text) type. Note: we choose the CSV / text as an example, because all vendors today allow the export of counters in this format. Nothing prevents us to use other formats. (We’ll do it later)
Data are for 4 days (August, 13 to 16, 2011). The period, only one hour: 18-19 for each day. Of course, you can download the data for all hours. We only use this time just as an example.
The procedure is - early in the day, download the data, and generate the analysis for past day(s). This can also be automated, but let’s start doing this task manually, since it is faster, and helps you understand the idea. Later we show how ‘everything’ can be automated!
And suppose also that you have not been to the office on one day. No problem, 'the other day, download the data of two days in the same file. Note: This applies not only two, but how many days you want or need. For example, the first time you run, you can search all available counters in the OSS days, and then follow just adding up.
It is easier to understand seeing the sample files stored in their proper location.
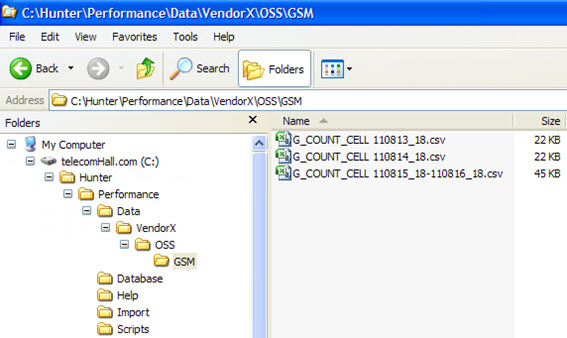
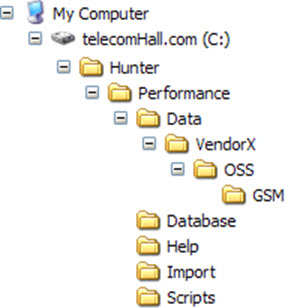
Note: This suggested form organization is ready for multi-vendor, multi-technology, and also multiple sources of input data (not just OSS) - a report from another tool or portal. We will discuss this with our evolution. In our case today, we only need the directory ‘GSM’, downloaded from the ‘OSS’ of ‘VendorX’.
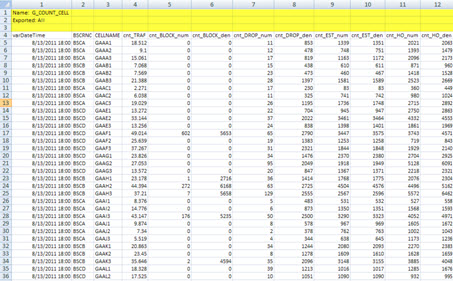
Note the name with we saved the files with raw counters: ‘G_COUNT_CELL’ + ‘’ + Free Description.
This nomenclature has two reasons. The first is to help identify the data (days, hours, elements) that is in each saved file. The second, and more important: identify the name of the table where they will be accumulated.
In VBA, we inform that the file data should be imported into the it’s text string until the first ‘white space’. This is just one way to do it, but we believe it is simple and applies - let the tool to identify, from the file, which table should get the data.
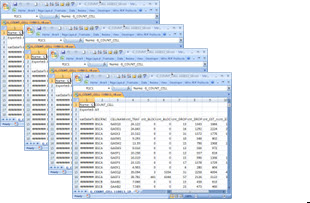
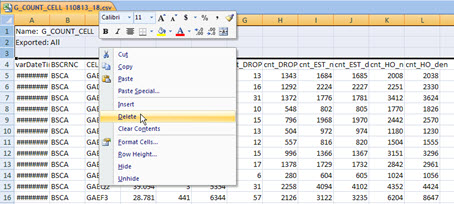
For the parser sample, ie, treatment of the file to a suitable column format, we insert some unnecessary extra lines, as the header of each file. So we can see a parser in action - open each file, and do the parse - in our case, simply delete the extra lines (shown in yellow below).
To complete the scenario: This site is a repository of counters, not the location where they will be imported. We could do this, and just tell our tool to find these files there. But we prefer to leave these files ‘unchanged’, and copy those that must be imported into a predefined location. Because, notice that the parser ‘changes’ original data, and if any need for further verification, we can compare with the original file (not the parsed).
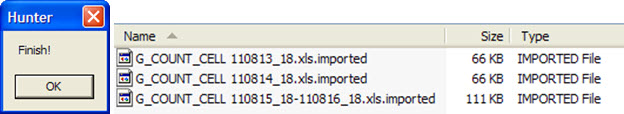
And the predefined place for this import is the ‘Import’ directory: all files are in this directory will be processed when we run the tool. And for each file processed/imported, the tool adds the suffix ‘.Imported’ to it. Thus, we can do a quick check that all were imported or whether there were any problems.
See the files after they are processed / imported.
File Structure
Our data organization is defined by the basic structure of Hunter, as shown in all other tutorials. If you’ve been following the evolution, the directories of this module are already created.
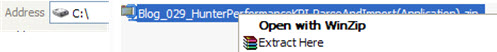
IMPORTANT: All files that you receive for each tutorial, are in this expected format. Simply click ‘Extract Here …’ using ‘WinZip’ or ‘WinRAR’ - with this file in the root directory ‘C:’.
Note: In addition - every time/tutorial you do this, the structure becomes increasingly more complete - not only for this module, but for all the others. Remember that everything is integrated in Hunter. Further on, we’ll take advantage of this integration.
After extracting the files of this module, you have everything configured properly as follows.
We’ve talked a little about the main directory of this new module. And you already know the purpose of the other standard directories such as ‘Scripts’ and ‘Database’. The only thing here is that today we are still not using the directory ‘Database’. Today, data is only counters, and our database of Performance is intended to contain only the processed data (Indicators).
But again, do not worry, it will become clear in the next tutorials. Worry today only about understanding the process of ‘parsing’ and ‘importing’ a file with counters into a cumulative table.
The Application
This application is completely made using Access with VBA. And this time, we’ll show the evolution of the application from an empty database (blank).
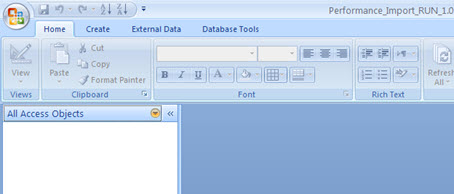
In today’s application, we’ll create a user interface. This is because this application is the beginning, where we want you to understand the concepts. In addition, we have only one table, one macro (to run), and less than 100 lines of VBA code.
So you can practice, understand the idea, and a few new concepts.
Importing the Counters to a Table
To practice, we first import a file with counters. We do not have a parser, then we need to make some ‘manual’ adjustments (soon VBA will do it for us).
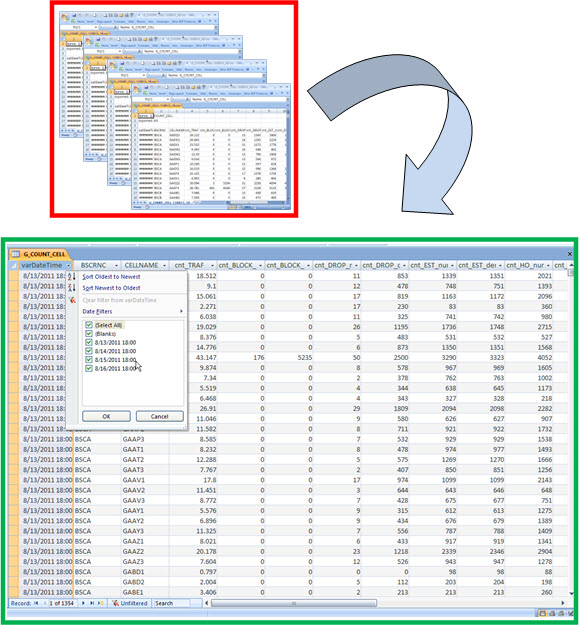
Using Windows Explorer, open one of the sample files (eg ‘G_COUNT_CELL 110813_18.csv’), and delete the header lines - just leave the field with the column headings as shown below, saving the file.
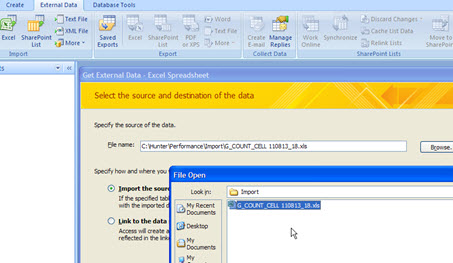
Then import this file (Menu: External Data -> Excel).
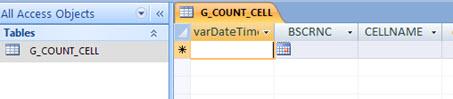
You’ve learned how to do this in previous tutorials, and should then have a table like the one below.
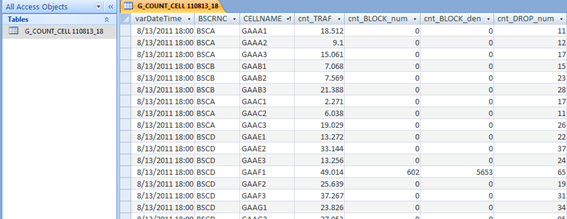
But this table is the table that will accumulate the counters for every day, then change the name of ‘G_COUNT_CELL 110813_18’ to ‘G_COUNT_CELL’ only.
Also, the data must be fetched, processed and imported automatically by the tool - then delete the table data.
And if I import duplicate counters?
It can happen, for some reason, to import duplicate counters, for example if you import a file twice. In this case, what to do?
Do not worry: a very simple solution is to define a primary key in this table, so even importing the file 2 times or more, the data will not be duplicated - the primary key already does this for us.
Do not be scared, we need not enter the field of Relationships. We use here only the primary key to set the records that are unique. In our case, it means ‘varDateTime’ + ‘BSCRNC’ + ‘cellname’. (It is more or less like in Excel a concatenation of these fields, in another field).
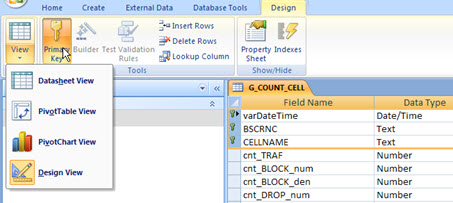
In Access, we define the primary key table accessing your Design (1), selecting the desired fields (2) and clicking the ‘Primary Key’ (3). Finally, save the table.
Now do the test: select the data file that we’ve imported previously and paste into this table.
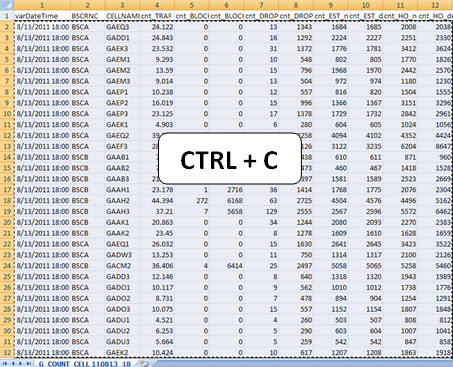
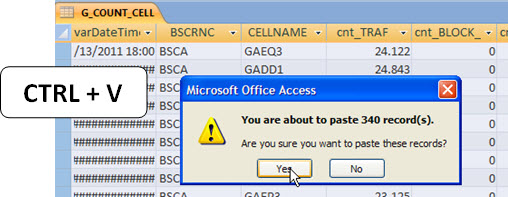
The first time - with the empty table - the data is pasted (imported) correctly. Now select the last record in that table, and try to paste the same data again. See what happens.
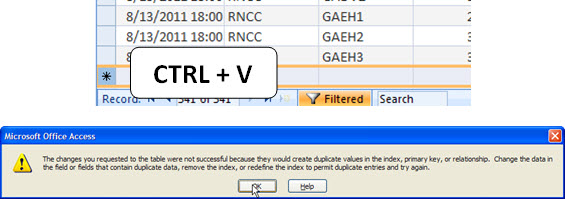
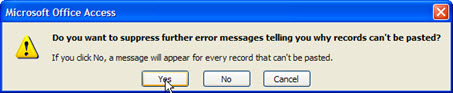
Access reports that this is not possible - primary key violation! Click OK. In the new dialog box, click ‘Yes’, ie, tell Access that you do not want a message to each record that broke the rule of exclusivity.
But you may be asking, and it will not generate an error when the application try to automatically import the data? Yes, this error will occur, but we inform to it (VBA) that it should just ignore it.
Let’s continue. Our table is ready to receive data and accumulate it correctly. Then, just import through our macro.
As we know, the ‘work’ will be done here, using VBA.
VBA Code
Since you’re already used to, all our supplied code (Hunter employees) is always discussed. This makes the explanation again here redundant, extensive and unnecessary.
IMPORTANT: The full code, including lines with comments, you have less than 100 lines! Still, if you encounter any problems or have any questions on any procedure, please contact us by posting your question in the forum.
Error Handling
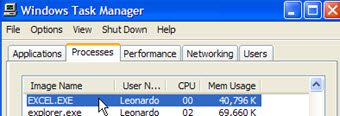
That our application, at the outset, it has a little ‘limitation’. How we work with Excel, creating instances of the same, we should have another Excel file open while it runs.
If you tried, and Excel is running (any open spreadsheet), it will give error.
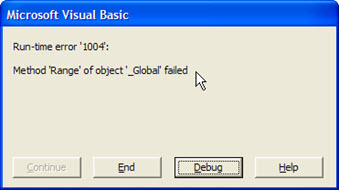
But do not worry: in future, we’ll show you how to treat each instance of Excel. We simply didn’t included it today because these codes could take over the focus of what should be learned today.
What about generic error handling in the future we will have complete tutorials on this subject.
Result
Anyway, the result.
At first, it may not seem very useful. Just a table with all the counters accumulated? We can do this manually.
But the great thing is, this is only the basis for all the possibilities that we will demonstrate and teach how get, soon. Charts, Dashboards, Rankings, Delta Reports … via email, SMS, HTML … Integration of Physical and Parameters and Network data… Geo analysis in Mapinfo/Mapbasic and Google Earth … And much more: you may have noticed, don’t You?
And the most important of all. Practicing and learning, besides being extremely simple to adapt for your own scenario, allow you to create new modules - everything you need and your imagination wishes.
And of course, always count on our help.
Good, for today that’s it. We hope you’ve enjoyed, we always try to show the world Telecom a simple and easy way.
And get ready for new tutorials!
Last tip: Do not postpone to practice tutorials. Although simple, the next will be the thirtieth tutorial. Each tutorial has 10 to 15 pages (MS Word). In other words - between 300 and 450 pages!
Challenge Answer
In the previous tutorial, we’ve challenged you to find a way to identify the default values for each parameter of your network, using the ‘Hunter Parameters’ module.
Since the feedback was not so good (only 22 Hunter users have e-mailed - congratulations again to those who found the answer), we believe that this is not a good practice - all others must be very busy, and one of the reasons they have become donators is do not want to wrap their head when not needed. So, let’s not be putting challenges anymore.
Anyway, the answer - and ending that tutorial…
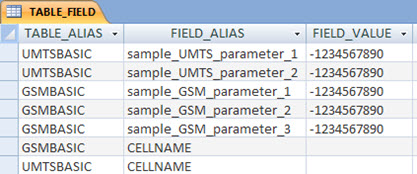
To identify a default value of a parameter, or at least identify the value currently configured for most cells in the network, simply assign an absurd value (such as -1234567890) to it, in the table TABLE_FIELD!
No fields (parameters) will be configured with the absurd value. And so, everyone will be ‘wrong’, and will be identified by tool - accumulated in the Audit table!
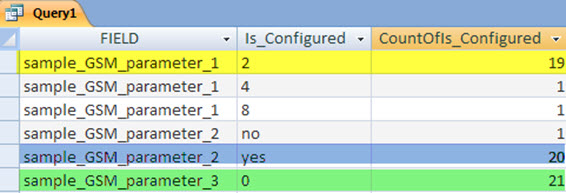
Running the tool, you have the result, and creating a query for table ‘Audit_Check_Parameters’, you have a resume.
Conclusion
We have seen how to create another customized application using Microsoft Access.
The application, though simple, is the basis for several other applications that we’ll demonstrate next.
The application is complete and functional with dummy data, and nothing prevents you to use it on your network instantly, and also to make your own improvements / extensions.
Thank you for visiting and we hope that the information presented can serve as a starting point for your solutions and macros.
In particular, we thank the donators of telecomHall. The tutorial files have already been sent, please check. If you have had a problem upon receipt, please inform.
New tutorials are ready, and will be published soon. As more users become more complex (although explained in a simple way), we recommend that you take all the doubts that happened there.
Remember, your acquired knowledge can be your biggest difference, just depends on your will.
Download
Download Source Code: Blog_029_HunterPerformanceParserImporter(Application).zip (234.7 KB)
