Introduction
Hello! If you are following all the tutorials, you’ve seen that we can represent our network through geo-referencing tools such as Mapinfo and Google Earth, and also that with this kind of tools we can perform tasks such as analysis of drive tests. But there are other important ways to evaluate a network, one, probably the main one, is through the analysis of statistics, and this is what we’ll start seeing today.
Start? Yes, start, because the analysis of statistics is a very broad activity, with numerous forms to be performed. The possibilities are very diverse: different data sources, processing, storage, analysis algorithms, output reports and graphs and so on.
And it is very important to say that the professional that dominates the analysis of statistics has guaranteed its success, and differing much from those who do not have that capacity. So what are we waiting for? Lets get it and learn.
Purpose
The purpose of today’s tutorial is to present an introduction to network analysis through the use of indicators and statistics.
These tests, as already mentioned briefly, are very broad, and can be as diverse and complex as we wish. For this reason, we will not get through to you all at once. And even if we tried, certainly would not have the desired result. We want you to learn above all, so we will do an introduction, a bit more theoretical, with the key concepts involved in statistical analysis. Not really going to stop practicing, even with the creation of a simple application. So understand this tutorial essential as a general preparation for other modules that Hunter will address specifically analysis of indicators.
As the concepts involved are many, will talk briefly about them, trying to give an overview. As we speak, this may be one of its best qualities as a professional, so enjoy each topic presented today. Why not take the time to go releasing their creativity: as reading, think about the ways of how you would do the same procedures. Remember that Hunter is always improvements, and their input will make a system more intelligent and efficient.
Our audience ranges from students to experienced professionals. So we ask a little understanding and tolerance are some of the basic concepts presented today are for you. Moreover, all the tutorials, codes and programs are a continuous process of editing. This means that if we find any error, for example, grammar or spelling, try to fix it as soon as possible. We would also like to receive your feedback, informing us of errors or passages that were confusing and deserve to be rewritten.
File Structure
New module - new directories and files. Create a new structure as shown below. The main directory that contains all other directories of the directory module is KPI (1).
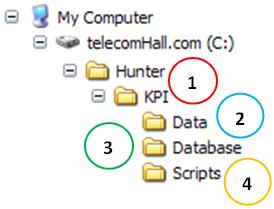
You should already be familiar, but remember that the input data are stored in the Data folder (2) to be processed by the codes that are in the Scripts folder (4), and finally inserted in the tables of the database, in the Database folder (3).
Once created the directory structure, we can proceed.
What are Indicators
Before anything, do you know what is an indicator? As its name suggests, serves as an indicator to signal or indicate how it is something. The indicators are based on a reference, and from it we know whether the measure is good or bad.
In a practical example, imagine a person with a fever. One indicator that we used to know it is temperature. Ie using a thermometer, which measured the temperature of the person. If it is much larger than about 37 degrees, she has a fever - bad. In other words, the indicators allow comparisons across qualify.

In the case of our network is not so different, the indicators are used to find out if it is bad, good or acceptable, for example. After each activity, we use indicators to assess the results of actions taken.
And what are the Indicators of a Cellular Network?
We have seen that indicators of a cellular network are many and can come from numerous sources. And since today we are still a general overview, let’s talk just a few - the most basic but most important, and then talk of others, all the time.
Continuing the analogy with the case of fever, and the temperature there are other indicators, such as whether the person is a headache or not, if the throat is inflamed, etc. . But note: only with temperature - too high - we already know that the person is ill - with fever. Other indicators in this case will help us see what the best remedy must be taken, ie what is the solution to be adopted. But the problem has been found! That is, only with the key indicator - temperature - we already know that the problem exists.
Returning to our world in a cellular network, see figure below. Note: Again we are using our limited graphics capabilities, please give more importance to content as the presentation here, okay? And if you have design skills, and want to help, contact us, we have numerous pictures to convert.
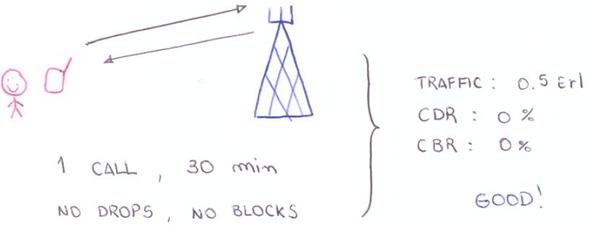
Suppose someone made a call, lasting 30 minutes. Suppose further that this connection was made without problems, ie, had no type of blocking, and it was terminated normally - did not drop.
Believe it or not, the above assumption already defines the key indicators of a network! Considering our universe of sampling only that person can say that our network had at the time a traffic of 0.5 Erlangs, a drop calls rate of 0%, and also a blockage rate of 0%. (What is Erlang? And Drop Rates? Relax, we’ll talk later.)
Of course you can not consider a sample so small, it is meaningless. But serves to illustrate.
Finishing the analogy with the case of fever, remember that the temperature can be regarded as a key indicator is not it? Well, in the case of our network, the three indicators above can also seen as key to evaluate the network. Therefore, these three indicators - traffic, drops and blockages, along with a few other like handover, form what we call Key Performance Indicators, more popularly known as KPI. The name is intuitive, and these indicators are the minimum for any analysis to be complete.
Indicators may also be of various types, always based on a count or measure. Can be considered absolute values, percentages, or other. It is common to use statistical formulas, and other resources like graphics and thematic maps, geo-referenced or not.
Now you understand why we spoke before the tests could be how much more complex and complete we do not? But do not worry, now we’re just going through the main concepts. There are several modules Hunter responsible for making the statistical analysis of the network more efficient and streamlined as possible. We explore in detail each of them soon, and almost all the concepts will be more detailed over time, whenever necessary. What we want from you today is that you have a general understanding. Just so we can continue
In practice, how are Indicators analyzed?
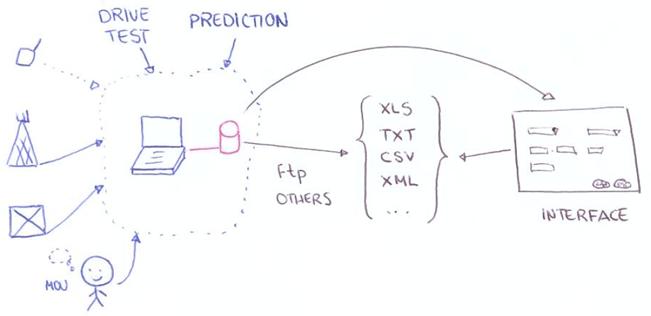
In practice, the indicators are stored - usually in the database and/or tables - to allow further consultations and historical analysis, but may be available in near real time depending on your application.
Whatever the source, the ideal is to consolidate data in one location, thus facilitating access to all information that may be useful in the analysis. Queries to these data can be done in several ways, via SQL, tables directly, or through proprietary interfaces and / or developed for this purpose.
The most common and easy to understand the indicators is through the OSS that provides statistical data on the network. It’s that program that allows us to download data for a particular period, for certain network elements.
Ok, the conversation is getting too technical, let’s change the focus …
The indicators are usually in clusters of counters, and a cellular network has thousands of meters. That’s right, thousands. Depending on the technology and vendor, the level of detail of the counters is very deep, why they had so many. All the more reason we know what we’re doing.
Again, it will be easier to understand when we do analysis in practice.
Automation
When working with a very large amount of data, and there is need for repetitive treatment of the same, automation becomes almost mandatory.
Professional tools professionals use advanced database and programming. For example using C#, Java or php accessing data in Oracle, SQL and other databases. The processes are periodic, and usually fetch data from any server via ftp. Complicated? Yes, but let’s not worry about this complexity. We will use artifacts and interesting at Hunter, where almost always reach the same results as these tools, you’ll see.
Without fear of anything humble opinion, we have a ready answer when someone asks if can 't do something, using a macro or something. The short answer is YES! Of course we’re talking in terms of analysis & computing, but with will and creativity, you will see that we really do almost anything you imagine more efficiently. This is the notion implicit in the tool over Hunter, and we want you also have this ability and consequent confidence. (And remember, it appears that some challenge you can not resolve, ask the help of our support! We are happy to try to help).
And how do we work with Hunter?
We will try, wherever possible, to reproduce the processes of an environment with automated processes and also non-automated.
We say as much as possible because there are steps that you probably do not (yet) should have contact. For example, when you have to download data from meters, how do you do? Probably through the interface of a non-OSS? Or perhaps via ftp? Even so, using any ftp program or something, and manually
In some cases we simulate the data have already been downloaded - exported from the OSS - for some specific times and days. Probably you will work with Hunter on a regular basis, or periodically (daily?) Accesses the OSS, and will seek the group of counters you want in your queries created or pre-defined, saving files in the default folder to import.
Over time we will find the best way. Now let’s continue.
Data
As always, our data are fictitious. Playing the most common form of output data from an OSS whatsoever, we have at least a field identifying the period (a) one or more fields that identify the element in its granularity (2) and the fields of counters per se (3) .
So we have an example of raw counter data exported from our OSS standard. Counter_kpi.xls will represent the file, located in the Data module KPI.
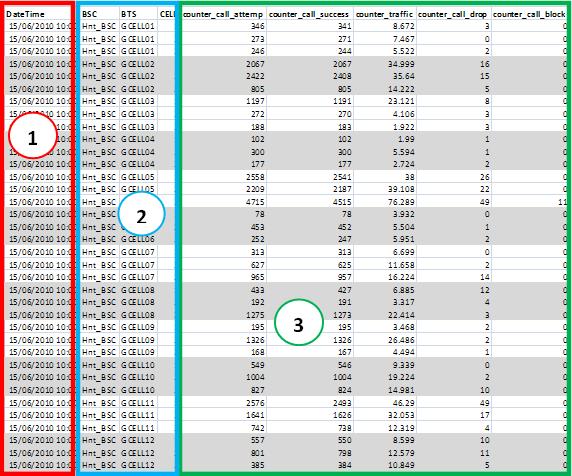
NOTE: In our example, for demonstration purposes only, the names of the counters are very intuitive. For example, the name of our counter who has the amount of dropped calls is counter_call_drop. In practice, this counter can have any name, eg xy123a, and their relationship and meaning be obtained from auxiliary tables. Moreover, the counters do not necessarily represent the indicator itself. The indicators are defined by metrics.
What are Metrics?
Metrics are the mathematical representation of the indicators, ie, what the calculations should be performed and which counters should be used to reach the desired value.
An example of metrics: dropped calls rate. The rate of dropped calls, like the intuitive name suggests, tells us how calls are dropping - the higher the rate, more calls are dropping, the worse is our network.
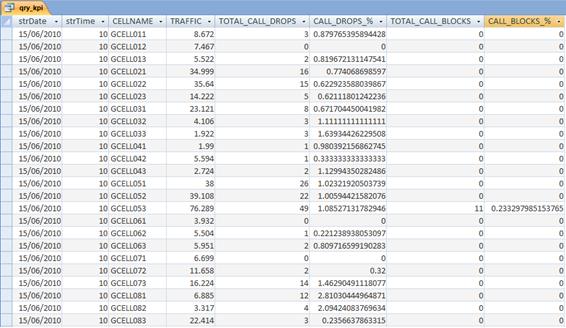
Following the counters defined in our example file, we define some metrics to illustrate. Query fields are qry_KPI.
-
TRAFFIC : counter_traffic
-
TOTAL_CALL_DROPS : counter_call_drops
-
CALL_DROPS_% : 100 * [counter_call_drops] / [counter_call_success]
-
TOTAL_CALL_BLOCKS : counter_call_blocks
-
CALL_BLOCKS_% : 100 * [counter_call_blocks] / [counter_call_attempts]
It’s done! We have a first report, pretty simple, but with very important information.
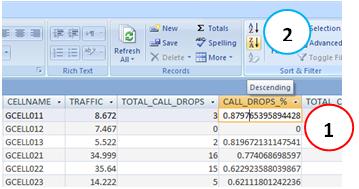
A quick way of working with the data is using the resources of Access itself. For example, to see what the industry with the worst rate of dropped calls at this time, click on any record field CALL_DROPS_% (1) and then click Sort by Descending (2). (As we speak but it’s just a fast, and not how we work).
If all this started to get confusing for you, fine. Rest assured because it will get easier when you practice.
Process
Ok, we log into our OSS, and export files with our counters data. And now?
Well, the next step is to store data in a table. So, next time when we have a new file created, we turn to import, and with time we will have a table with the accumulated data properly.
This is done through VBA. In our example today, we have a small sample application that performs the import operations (1), storage (2) and presentation of the indicators of network (3).
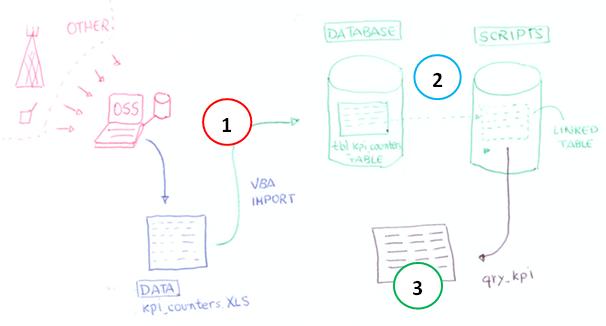
The cumulative table tbl_kpi_counters is in the database Hunter_KPI_DB.mdb, located in the Database module KPI.
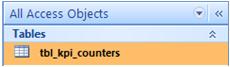
The database Hunter_KPI_RUN.mdb, located in the scripts folder of the module KPI, has this table tbl_kpi_counters linked. We’ve seen in first tutotrials the reasons to use linked tables, if in doubt, please re-read them.
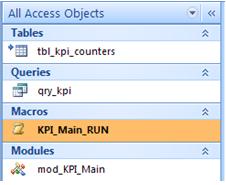
When we run the macro KPI_Main_RUN it to runs the VBA code that deletes data from table tbl_kpi_counters, and then import the data file kpi_counters.xls, located in the Data directory of KPI module.
The accumulated data in the table tbl_kpi_counters can be accessed through queries. We can create predefined queries for each purpose, and call them when necessary.
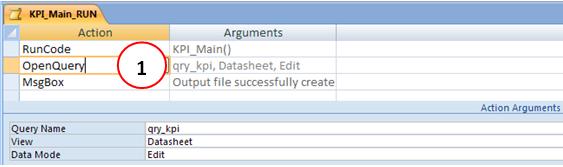
There are several ways to display the data: executing the query qry_kpi, directly through Access interface, or opening it through the VBA code, or even using a macro. To illustrate the latter case, we put the option to display the query with the final data in the macro, as shown below.
Let’s only see a few more tips and important concepts, to finish by today, okay?
Homogenization
Another concept that we use in the Hunter is the homogenization. This means that we seek whenever possible, consolidate all statistics in a single table, no matter the technology, supplier, etc. …
To make it easier to understand, imagine a network with a GSM equipment supplier A, and UMTS equipment from another supplier B. Instead of working with both so different, we prefer to group the data. Thus, we still can get reports separately, but is simpler and advantageous also obtain general reports.
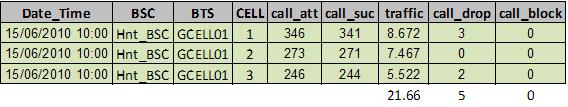
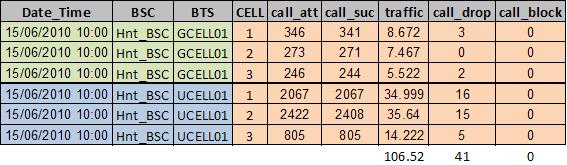
One example. We have a table with the KPI GSM, shown in green. We see quickly that we had a traffic of 21.66 Erlangs at BTS GCELL01, and 5 drops.
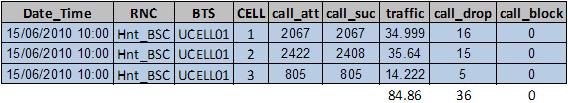
Similarly, for the UMTS BTS UCELL01, traffic was routed to 84.86 Erlangs, and had 36 falls.
But homogenize our data, we have a single table, and all queries can be done over it.
The same data are easily obtained in the previous final table. Except that we also aogra so simple, summary of the system! We see for example the site CELL01 (GSM + UMTS) had a total traffic of 106.52 Erlangs
Hunter Algorithms
Finally for today, we currently use four algorithms for data analysis with the Hunter, and they are:
- Top & Summary : the most common way to analyze. For each analysis period, a summary, with values for the entire system, and ancillary reports with the TOP N offenders in each item.
- Delta : the best way to check anomalies in the network, checks whether something is outside the expected pattern. It will be shown in more detail in a future tutorial (Hunter Delta KPI), and is essential for the area of O & M.
- Rank : more complete algorithm, involving weights and weights of all indicators. Also by its complexity, will be detailed in a later tutorial (Hunter Rank KPI).
We could talk much more about each of these algorithms that we use, and also on some concepts that have not yet seen. But by now you should be well filled head, no?
So, let’s stay here, at least try to understand what is generally through a network analysis of indicators and statistics. The details we will soon see, in each new tutorial.
Conclusion
Today we had our first contact with the Indicators Network, and we realize the importance of analyzing the network through statistics. New concepts so popular, but will be studied in more detail, and practical application in future modules of the Hunter, specific to each process and / or algorithm seen.
In oversimplified form, just for demonstration purposes, we created an application that simulates the basic procedures of import, storage and presentation of data. Although simple, allows us to imagine the gains to come with tools that help us both in processing speed, accuracy in the analysis and ease of operation - Hunter Tool.
We hope you’ve enjoyed. If you have any doubts, find the answers posting your comments in the blog or via our support via chat or email.
Till our next meeting, and remember: Your success is our success!
Download
Download Source Code: Blog_014_Network_Statistics_(KPI_Intro).zip (34.2 KB)