Introduction
We already learned some important concepts for Network plotting data on Google Earth. Today we will improve a little our application (Hunter GE Network) in order to achieve a more professional result and that allows to work with layers of various technologies.
In addition, we will learn what styles are and how they are used in a simple way to achieve amazing results, not only for the purpose that we see today, but also in creating thematic maps on whatever the application - Test Drive, KPI, Parameters, among others.
Purpose
From a table with information from our network, plot the data of sites and sectors, independent layers in a display-only technology, or only those desired - and distinguished by attributes such as size, images and/ or colors, in Google Earth.
Our audience is from students to experienced professionals. Therefore we ask for a little understanding and tolerance if some some of the concepts presented today are too basic for you. Moreover, all the tutorials, codes and programs are at a continuous process of editing. This means that if we find any error, for example, grammar or spelling, try to fix it as soon as possible. We would also like to receive your feedback, informing us of errors or passages that were confusing and deserve to be rewritten.
File Structure
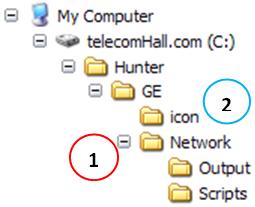
We are making changes in existing module - GE Network (1), so the directory structure is already created. We will also use the directory icon (2), but this is a common directory several other modules Hunter EG. If you have followed the tutorials, you should have a structure like the one below.
Multi-Technology Network
Hardly you will only work with a technology in its network. And even that works only with technology soon will emerge a new, and inevitably you will work with more than one. This is our area, always evolving, always emerging new technologies.
The most common technologies today are GSM, CDMA and UMTS. Remember that we started our tool with sample data to the GSM technology. Today, we will include data UMTS, and thus be possible to demonstrate what we want.

We mentioned earlier because we chose to represent sectors in the form of line or arrow, instead of the symbol as a petal or cone. Looking back, mainly because it allows us, when desired, view all the technologies at once, identifying for example, when the azimuth of the sector of technology is different from the azimuth of the same sector in other technology. Anyway, believe it will be easier for you to understand that after some practice.
Styles
What is a style? Well, if you have followed the tutorials, you should remember that we use the Normal style to display and highlight industry information when you hover on the edge of it. But okay, even if you do not remember, let’s see what this is, as styles go far beyond the example where we use them, and they are very important part of several modules Tool Hunter.
Styles can be understood like a feature set. For example, when talking about someone who is American, of course you understand that he speaks English as their native language, make purchases using U.S. dollars, etc… Already said that another person is French, we know that language is French, the currency the euro, and so on.

In our case it is more or less the same thing, only now we are dealing with text (size, color) lines (thickness, type, color), and all those properties we have at our disposal, depending on the tool we are using.
Styles in Google Earth
Each application has a way of representing their style. In the case of Google Earth, the styles are defined by XML syntax, in creating the KML file.
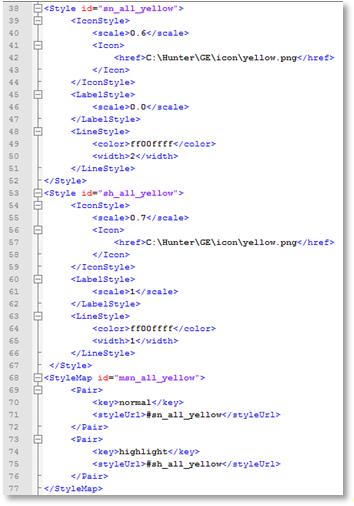
Note that the style is defined in two ways: normal, highlight, or without the mouse over, and with the mouse over it.
We define styles of properties. In the example above, we define the style all_yellow, which means everything yellow. Thus, when we apply this style to some element, it turns yellow. But it gets easier to understand in practice.
data to generate the Output File
addition to providing fixed or predetermined, as legend and styles, there are data variables, which are information of our network, as an antenna, azimuth and tilts. Let’s create four layers:
- GSM BTS Sectors
- GSM
- UMTS BTS
- Sectors
- UMTS
Of course, we have four queries, which we will call through the code, obtaining the data, and formatting syntax KML properly with the output file.
One way would be to create queries using the code itself. But as you may still not be very familiar with this manipulation, we prefer this tutorial to create the four queries, one pair each type of information.
Until today because we will see a function, we will use to differentiate elements of the elements GSM UMTS. What should I do?
Well, the simplest way would be to have a field, for example technology in the table with this information for each line. Another way, an alternative is to find a handle for each technology.
At our table the elements are named GSM initiated by G, and elements UMTS, initiated by U. Now we can create a calculated field, and use this field to handle.
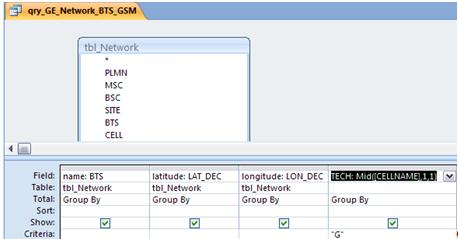
Let’s see an example that should be easier to understand, with a query that returns the GSM BTS.
Note qry_GE_Network_BTS_GSM query. Add a new field TECH , the value TECH: Mid ([cellname], 1,1).
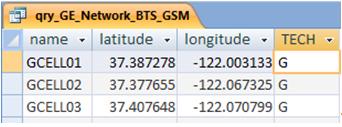
The result of query execution is shown below.
Repeating the same for sectors and then to UMTS BTS and Sectors, our database is then like this:
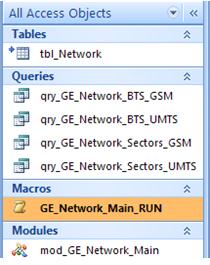
Where we have the data through the linked table (tbl_Network), qry_* queries with the data as mentioned, GE_Network_Main_RUN macro that generates the output file, and module mod_GE_Network_Main, with the VBA code that does all the processing.
The Code
So come on and take a look at the VBA code.
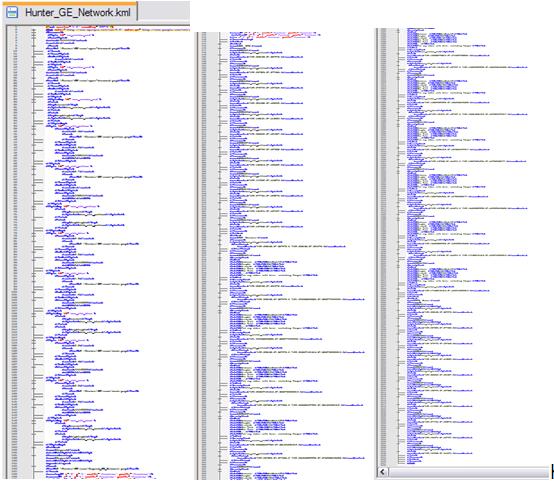
The aim of the code is to write the file. KML, as shown below in a macro way.
Note: Again, remember that there is little point in extending stay here too explaining each new detail, for two main reasons. First, because our goal is not to teach programming, but the solutions through examples. And second, because all the necessary files, with full code and fully commented are sent, and no doubt still persists can be taken with the support.
New concepts and functions
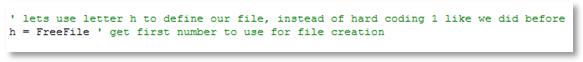
As news of this tutorial, we use the FreeFile function, which returns a number of free file for usage. Assign that number to a variable, if we use the variable h.
We begin exploring the use of functions, rather than simply go writing code line after line. At first it seems a little harder to understand, but you’ll notice that it is much easier and organized, especially since when we have increasing applications.
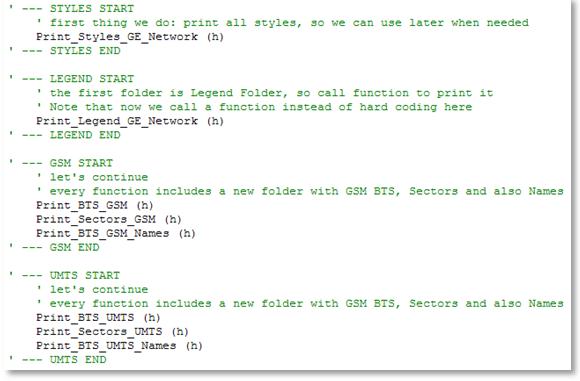
There is no mystery here, but we will continue reading the code to show how following the program. When executed, and reaches the line Print_Styles_GE_Network (h), the sequence jumps to the corresponding function, taking the number of file h. And then you type in the file, as determined, the KML syntax to create a legend of our data.
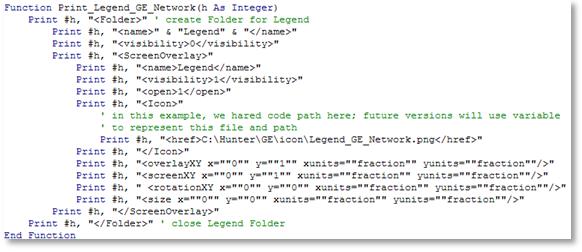
Note that our image of the caption is the file C:\Hunter\GE\icon\Legend_GE_Network.png. Just to complicate not we type this value function, but a good practice, and indeed one of the advantages of the functions is that they can become very generic.
For example, we have assigned the value of that image to a variable, and when we called this function, informaríamos which the value thereof, as shown below.
Print_Styles_GE_Network (h, “C:\Hunter\GE\icon\Legend_GE_Network.png”)
But again, just to avoid complications, let these optimizations for another time.
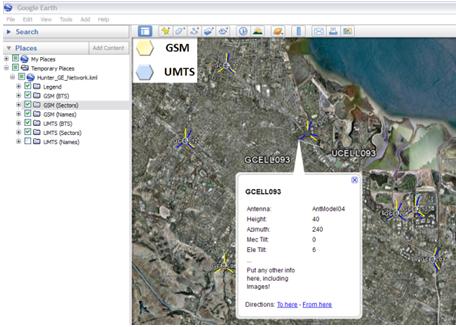
Another feature worth to be highlighted is the use of HTML in the creation of the Info window (when clicking on the edge of a sector).
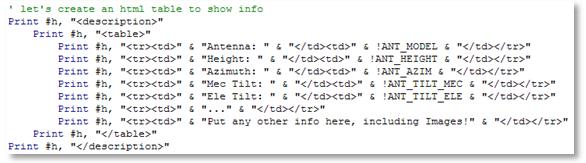
Note that since we can use HMTL, we include links, images, etc… This functionality will be further explored in the future, but we already have a table with key industry figures clicked.
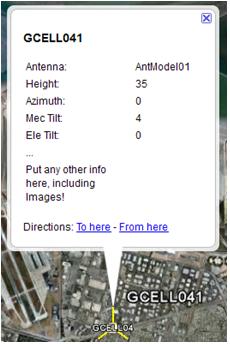
Any other information can be entered in this table. Even the table can have more columns, etc…
Another important information is about how styles are applied. The same are defined by tag . In the example below, we use "# msn_all_blue " immediately before the tag, so all these points this placemark will have all its features blue (once we define what our style has blue all blue).
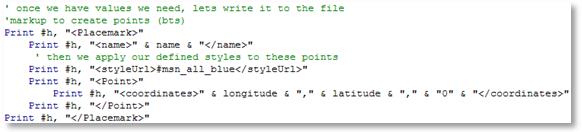
Maybe getting a little complicated. Believe me, it is not. What happens is that it is a new concept. Over time, you will use, and will realize how becomes more intuitive. It is as if we spoke: “From now on, everything I do will be blue.” And of course, remember that you always have our support!
The end result is shown below, but it is better you open using Google Earth and try the different combinations you can use.
Conclusion
In this tutorial, we learn a bit about styles, and we saw ourselves as very helpful in creating applications with a better viewing experience. The result, better analysis, faster and richer in detail.
We also continue our contact with VBA, learning new concepts, and also to write a code calling other functions. At first it seems more complicated, but in time we realize that it is much simpler, especially when our applications are larger and have more reuses.
We hope you’ve enjoyed. If you have any doubts, find the answers posting your comments in the blog or via our support via chat or email.
Till our next meeting, and remember: Your success is our success!
Download
Download Source Code: Blog_012_Hunter_GE_Network_(Multi-Tech).zip (226.7 KB)