Introduction
The analysis of drive test are key to any kind of telecom professional, either in the implementation of data collection or just in the analysis. Although through the analysis of KPI’s you can identify problems like dropped calls, the drive tests allow a deeper analysis in the field. Identifying areas of each sector of coverage, interference, among others.
Purpose
Learn what is a test drive, and how to load data collected in Mapinfo and also in Google Earth. Knowing basic kinds of thematic maps and individual ranges.
NOTE: This is an introductory tutorial, and see the future and make a more detailed analysis using Hunter Mapinfo Test Drive - which uses the Mapbasic to automate the plots, and Hunter GE Drive Test - that it would also be automated, has a plot of data in more detail, for example getting data from each section by clicking it. Anyway, this tutorial should be well understood, because the concepts are the same whether doing it by hand, is using automation scripts.
Note: Our audience ranges from a student of Telecom by experienced professionals with extensive knowledge in the area. So we ask a little understanding and tolerance are some of the basic concepts presented today are for you. But they are necessary for the joint development of all.
File Structure
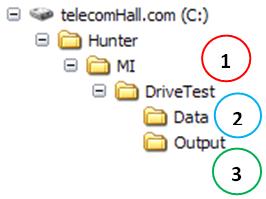
As always, we create the proper directory structure for files that we use. Today we need the structure as shown below.
-
(1) DriveTest: root directory of the module.
-
(2) Date: where are the input data, eg collected in the drive test.
-
(3) Output: the output directory where the files are output as images of the plots, KML files, etc..
But what is a Drive Test
Drive Test, as its name suggests, is the procedure of conducting a driving test. The vehicle does not really matter, you can make up a test drive a motorcycle or bicycle. What matters is the hardware and software used in the test.
Basically, to hold a test drive we need a Notebook (1) - or other similar hardware - with a Software Collection (2) installed, a Security Key (3) - Dongle - common to these types of software, at least one Mobile Phone (4), a GPS (5), and a scanner (6) - optional. Also common is the use of adapters and / or hubs to enable proper interconnection of all equipment.
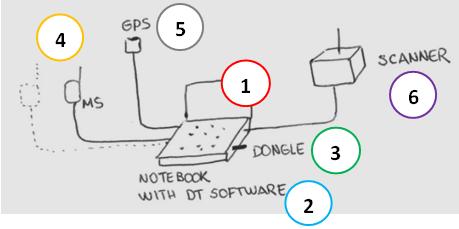
Note: some figures shown in this tutorial (as above) are representations of diagrams as a blackboard. Of course we want to do professional illustration, vector with software, etc.. But remember that telecomHall team consists of engineers, and our focus is learning. We believe that the content presented stands the lack of perfection in the diagrams. Anyway, if you have skills with drawing, and would like to contribute, your contact will be very welcome! Contact.
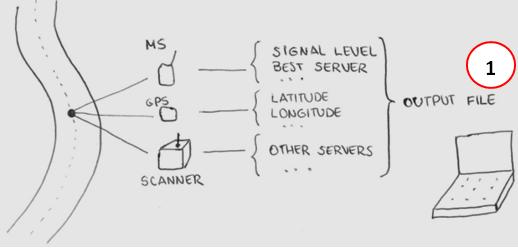
The main goal is to collect test data, but they can be viewed / analyzed in real time during testing, allowing a visualization of network performance on the field. The data of all equipment are grouped by collection software and stored in one or more output files (1).
-
GPS : collecting the data of latitude and longitude for each point / measure data, time, speed, etc.. It is also useful as a guide for implementing the correct routes.
-
MS : mobile data collection, such as signal strength, best server, etc … They are typically used two phones. A performing mobile calls (CALL) for a specific number from time to time, configured in the Software Collection. And the other free or IDLE mode, ie connected, but not on call. This is to collect specific data and IDLE modes CALL.
-
SCANNER : collecting data across the network, since the mobile radio is limited and does not handle all the necessary data for further analysis complete.
The minimum necessary to carry out a test drive, as we shall see, is a mobile device with a collection of software and a GPS. Currently, there are already mobile phones that do it all. They have an internal GPS and a collection of specific software. They are very practical, but are still quite expensive.
In addition to providing voice call may be carried out other types of calls such as data, video etc.. Will depend on the technology (GSM, CDMA, UMTS, etc. …), and the need to analyze such data or not.
Anyway, whatever the equipment, software and procedures used, the end result is always the same, the output file.
The vast majority of software collection (or processing) do or have together some software which also makes analysis. These are called post-processing software. Each post-processing software has its own specific analysis, and how much data (measures) is huge, they can be of great help to solve specific problems well.
Note: It is our goal today we extend a lot about drive test, and we will stick to the generic procedures for plotting to carry out the analysis. If you have any questions, just contact us.
Regardless of what the post-processing software, have all the functionality to export data in tabular form, in plain text or CSV. And that’s what we use.
One advantage of working with the data this way is that no matter how they were collected, but its content. So for example we can, even if a team has run half the route with a type of software, and another team of drive test with another shot the rest, we can plot the data from our network on a single desktop. That’s where for example the generic software analyzes geo-referenced, such as Mapinfo and Google Earth.
Another advantage is that the analysis available in Mapinfo and Google Earth is generally a better use, since they are more familiar to most professionals, and not specific to those who only performs / looks drive test. This can be understood in not having to acquire multiple software licenses post-processing, one usually sufficient for deeper analysis.
Plotting the data in Mapinfo
As always, our data are fictitious. Thus, we create a file with random points around our network, like a test drive it, except that you may notice that the streets do not match exactly with the images of Google Earth.
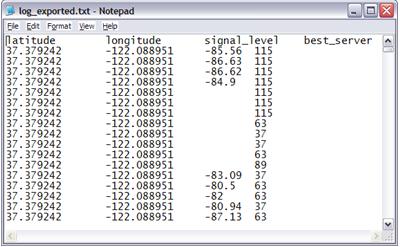
The parameters are not even real. In this case, we use two dummy parameters, one containing the signal level collected (we’ll call signal_level) and another containing the information sector of the call server at each point (best_server).
This file is like the file exported by the team that made the data collection, and call log_exported.txt, located in the C:\Hunter\MI\DriveTest\Data.
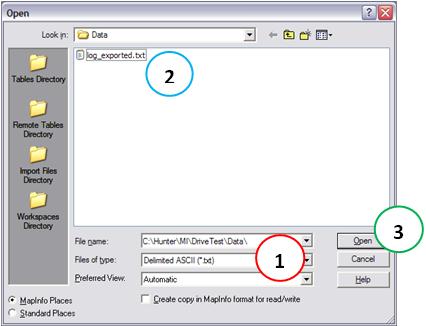
Sure, we have the files in tabular format. The first step is to open this file in MapInfo. We have seen how to open an Excel file format in MapInfo. We will now open up our data in tab-delimited text format. To do this, go to Menu File → Open, select Files of type display *. txt (1) and select our archive (2). Click the Open button (3).
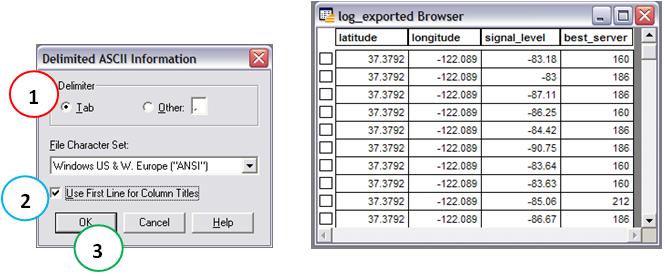
Our file was exported using tab as delimiter, so the dialog box select this option (1). And the first line has the column headings, then check this option (2). Click the OK button (3).
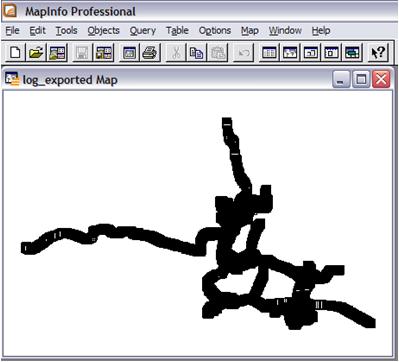
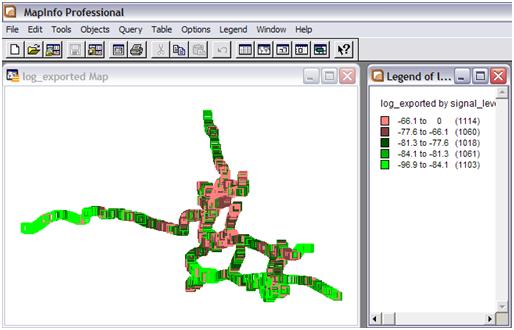
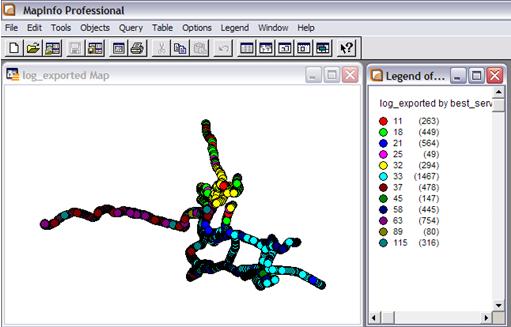
With the file open, the next step is to create points for himself, and create a new map with the data. Also as seen previously in another tutorial how to do this, and the result is seen below.
Note: soon, Hunter Drive Test Mapinfo tutorial we will see how these and other tests on an automated (scripted MBX). We suggest that you open (and leave open) the window while you are doing manually Mapbasic commands Mapinfo. This is because you can get more familiar with the syntax of the scripts that will receive Mapbasic
Note that the map with the data just opened in Mapinfo not bring us any interesting information (even if for example we can verify the extent of each section by clicking on it). We need to create thematic maps, according to each parameter measured.
A thematic map is a map with symbols and colors specific to pre-defined values of each parameter in each point. For instance, we color all points of the map that have the information signal level greater than -65 dBm with the color green. So, visually we have the area (green) where the signal is very strong. This is the case of Thematic Map using Ranges. (The unit dBm refers to signal intensity, and we’ll talk in detail later).
We can also color in a new thematic map information from the best server for each point using a single color for each server, and so we see the coverage area of each sector. To do this we create a Thematic Map-based Points - Individual.
Ranges of Thematic Map
First, we view the signal strength of geographically distributed in the area where we performed the test drive. For this, we will create a Thematic Map by Ranges.
The creation of thematic maps is one of the most important commands of MapInfo, which enables a huge amount of changes. Today we use the standard symbols suggested for each type of information present in the data table. Later we will see settings that give a better presentation of data.
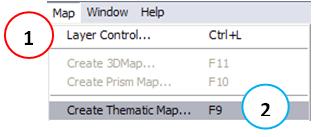
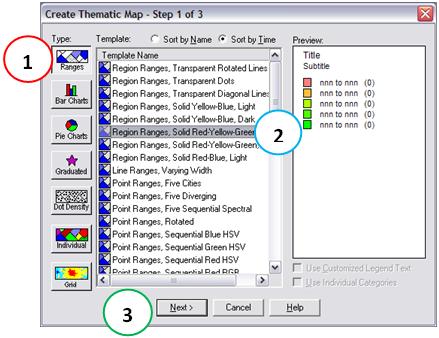
Access Menu: Map (1) → Create Thematic Map … (2). Or press F9.
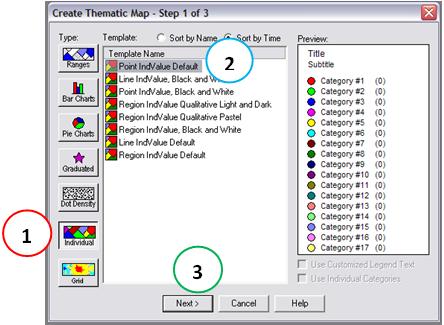
In the new window that will appear, select the type Ranges (1) and choose a type of range, for example Red, Orange, Light Green, Green (2). Click the Next button (3).
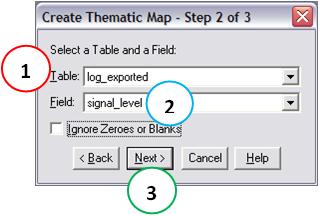
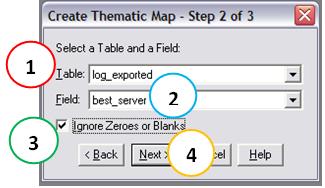
In the next window, select the table and field that will create the thematic map. In this case, choose Table log_exported (1) and field signal_level (2). Click the Next button (3).
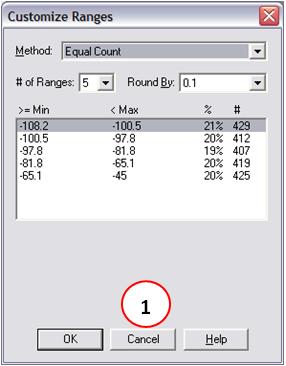
In the next window we have a few options that can and will be used later. You can see some of these options by clicking the appropriate button. Below is the window that opens when clicking the button Ranges … allowing for example change the number of ranges and methods. Click the Cancel button (1).
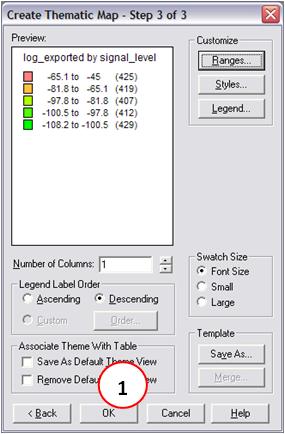
At the moment, as we are learning how to plot the data thematic ranges, so we’ll just accept the standards proposed by Mapinfo and click the OK button (1).
The result is a thematic map plotted.
Individual Thematic Maps
Now we want to see the coverage area of each sector. For this, we create another thematic map, with individual values, and we use the field best_server, which has the information industry.
Access Menu: Map → Create Thematic Map … In the same way we did before. Only now in the new window will appear, select the type Individual (1), and select Single Point Value Pattern (2). Click the Next button (3).
In the next window, select the table and field that we use to create the thematic map. In this case, choose Table log_exported (1) and field best_server (2). You can also select the option that ignores if any field with value of zero or empty (3). For ranges, the previous example, we could also have chosen this option. Click the Next button (4).
As for ranges, we can define the plot according to our needs, such as specific colors. But for now the default plot of the data is sufficient for us. So, click the OK button (1).
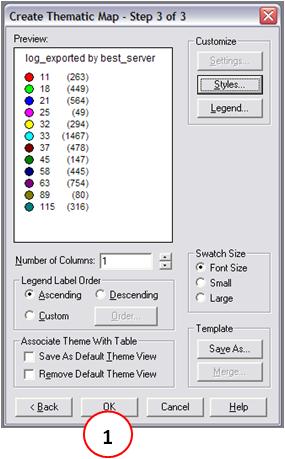
The map is plotted.
From very simple way, we saw how to plot data collected in a drive test in Mapinfo. Remember that the steps presented here is intended only for demonstration and learning. All our drives will be processed automatically through scripts provided with much more customization and standardization, using the actual parameters. But it is very important to have knowledge of basic concepts and procedures used to obtain the same results.
Plotting Data in Google Earth
Likewise we have a specific module for automatic plotting of data from the drive test in Mapinfo, we have a module - GE Hunter Test Drive - for Google Earth. This module is specifically a more specific and detailed, but not least, given the ease of analysis that Google Earth provides, as we have images in optimum resolution of the local drive, relief, among others.
Anyway, there is a middle ground where we can quickly see any data that is already plotted on Mapinfo directly to Google Earth. In the past Mapbasic were using a script, but currently is available from an auxiliary tool Mapinfo that does this work in practice: the utility MapInfo Professional Link Utility for Google Earth
For users of MapInfo from version 8 (currently is at version 10) you can download this tool from MapInfo’s website that allows to plot the same data in Google Earth. (Unfortunately, the tool does the opposite, ie not behind the Google Earth data to Mapinfo, but undoubtedly, it is helpful). This is a topic for another tutorial.
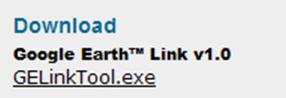
Then, download the tool SmartUpdate: MapInfo Professional's Link Utility for Google Earth.
This is a compressed file with a series of files within. Extract the files to a directory, and locate the file GELink.mbx within the sub-directory GoogleConnect. This is the file Mapbasic that does all the work.
Let’s pause here and learn a bit more of Mapinfo and Mapbasic.
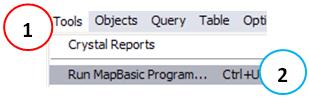
We saw that MapInfo has your macros or programs, created and compiled with Mapbasic. These programs can be run by accessing the Menu: Tools (1) → Run Program Mapbasic … (2), and locating the program MBX.
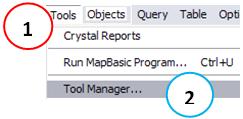
But it’s very annoying having to keep finding these programs whenever we open a new desktop (although Mapbasic programs can be run by double clicking in Windows Explorer). To arrange this, the MapInfo is a Program Manager Mapbasic. Go through the Menu: Tools (1) → Manager Tools (2).
Basically it gathers information on what tools are MBX (1), and if they are loaded (2) - available in current desktop - and should be loaded whenever the MapInfo runs (3). Marking the corresponding checkbox for each option define the behavior for each tool MBX.
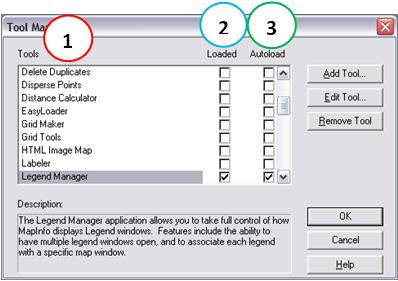
The Tools toolbar provides access to programs loaded.

Let’s put the program GELink.mbx to load automatically when we use the MapInfo, being always available on the toolbar.
First, as a matter of organization, we will copy the directory GoogleConect into the tools directory of MapInfo. This directory is C:\Program Files\MapInfo\Professional\Tools.
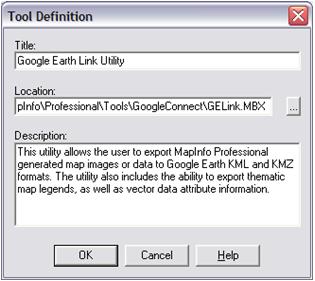
In MapInfo, open the Tools Manager and clicking the Add Tool button. Then navigate to the directory C:\Program Files\MapInfo\Professional\Tools\GoogleConect and select the program GELink.mbx. Fill in the program settings as shown below.
-
Title: Google Earth Link Utility.
-
Location: C:\Program Files\MapInfo\Professional\Tools\GoogleConect\GELink.mbx
-
Description: This utility Allows the user to export MapInfo Professional map generated images or data to Google Earth KML and KMZ formats. The utility Also includes the Ability to export thematic map legends, as well as vector data attribute information.
Lastly, we mark the checkbox Loaded 2 (1) and autoloaders (2). The result is as shown below, and clicking the OK button (3).
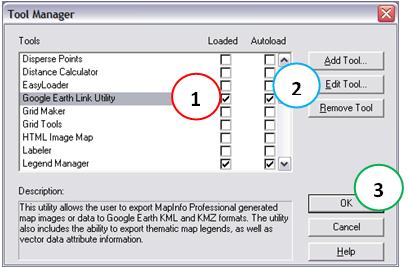
From now on, whenever we open the MapInfo, the program is already available.
Note: Of course it depends on how you leave Autoloader this program or not, running the same only when necessary. This was just a suggestion, but depending on the frequency may be more useful to leave loaded by default. Anyway, you decide.
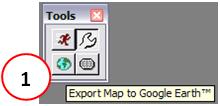
Well, back to the program specifically, each vector or raster data within the map window can be exported and the exported area is just the visible area of the map. The data is exported as KML. When executed, the program ends by opening Google Earth (you can uncheck this option). The program is accessible on the Tools toolbar as an icon of a green globe.
Let’s see how to use each option.
Plotting the data as Raster
In the Tools toolbar click the green globe icon, which calls the program GE Link (1).
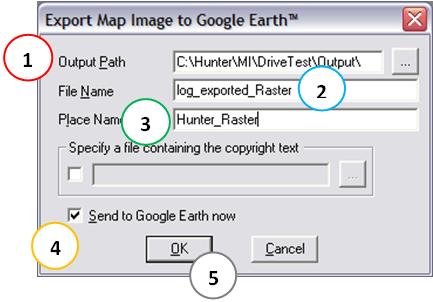
In the main program screen, choose the Output Directory (1) where the KML file is generated, the file name (2), and the name that will appear in Google Earth ( 3). Also check the option to launch Google Earth so that the processing end (4). Click the OK button. (5)
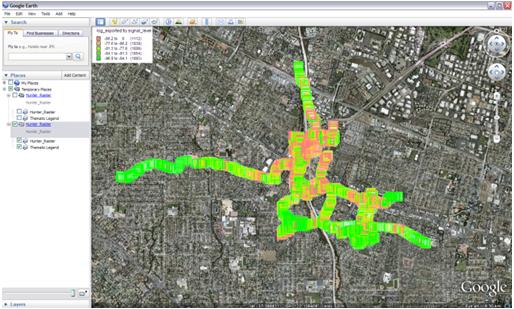
The result can be seen below.
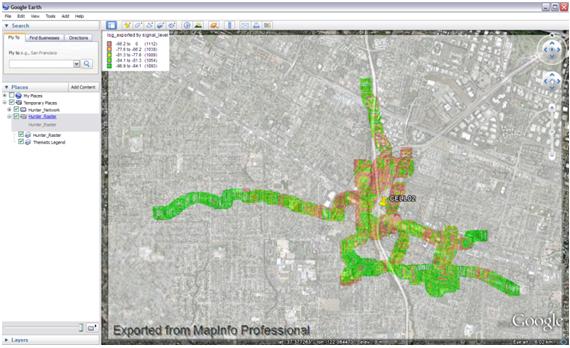
Note in the above figure, we set a certain transparency to get a better result, allowing images of the Google Earth and also the Test Drive. We have seen how does this but if you forgot to review how to set specific layers of transparency, review the tutorial of Google Earth.
Plotting the data as vectors
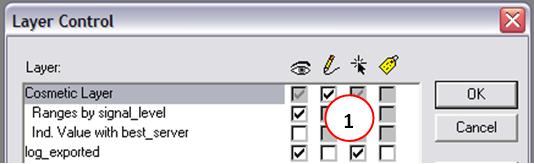
To plot the data as vectors, we need to select the desired data. And to select data - or objects on the map, it is necessary to make the layer is editable. For this, we mark the checkbox with an icon of a pencil editing for Level Cosmetic (1).
Yes, now we can edit the objects that are on the level (or layer) cosmetic.
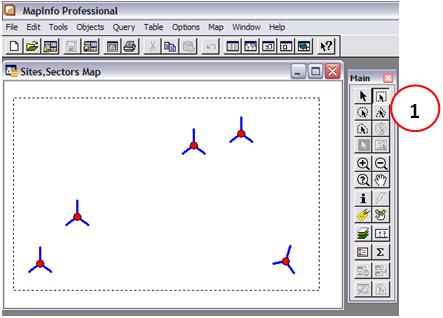
Note: Due to large amount of information to drive test, since each point is an object, the processing for converting Mapinfo to Google Earth takes a lot of each point. Thus, for example, we only use data from our network (sites and sectors) instead of drive test.
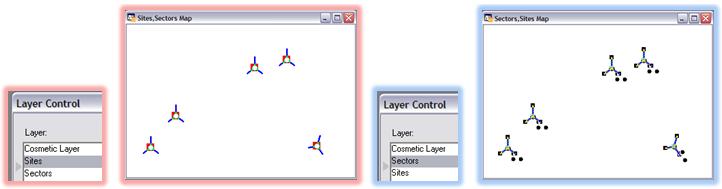
To select data we can use the Selection tool (1), located in the Main toolbar. We can also select data via SQL, but this is a topic for another time. Using one of the selection tools, select all the map data.
The selected layer is always the first layer in the Layers Manager. Here we see the result of the selection made when the layer Sites comes first, and when the layer Sectors comes first.
Note: Another option to select all elements of all tables at once would be to use SQL. But as we said before, is for another time.
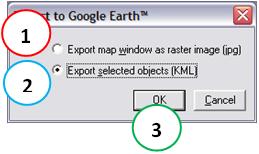
When clicked now - with an active selection - in the green globe to start the GE link, we are asked whether they wish to export as raster image (a) as we have done previously, or if you prefer export the objects (2). We chose the second option and clicking the OK button (3).
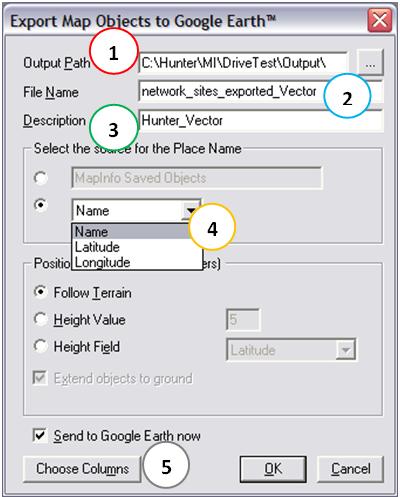
Again we have the main program screen, but now with some new options, because we are not only saved as raster, and yes, a KML file with some attributes. Choose the Output Directory (1) where the KML file is generated and set the file name (2), and the name that will appear in Google Earth (3). Source to select the marker which is more appropriate. If for example we are exporting the layer sites, it is normal to choose the Name field (4), which bears the name of the site. The other options can be left as default, it is only talk of punishment option button Select Columns (5).
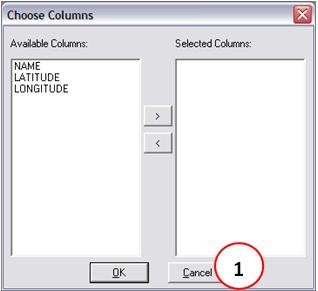
You can choose which fields should appear as attributes in Google Earth. If you do not choose anything, all attributes are available for example when you click a point. Let’s do this, click the Cancel button (1).
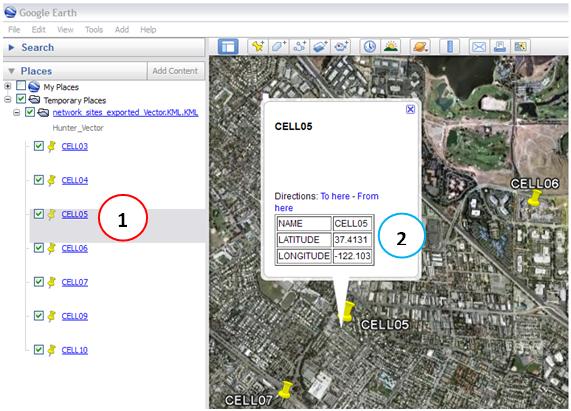
To finish, click the OK button interface GE Link. The result can be seen on Google Earth. Note that sites are clickable (1), and the information is available (2).
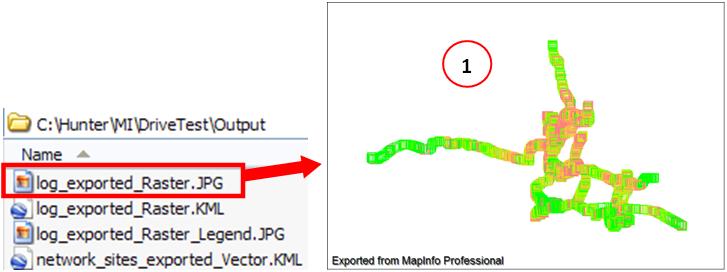
Finally for today, let’s just see one more detail. Note that the GE program Link, when saved to raster format, generates an image of type JPEG (1), as can be seen in the output directory where you saved the data. (It’s also generated an image file to the legend).
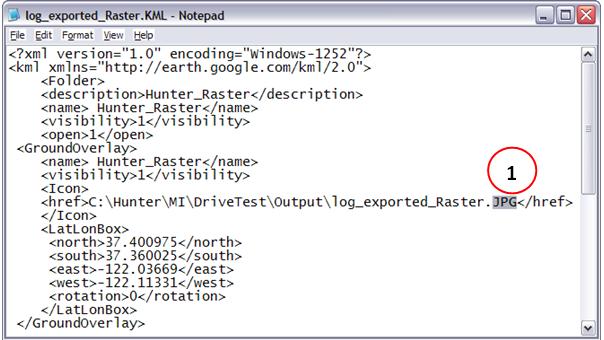
And if you right-click and open the corresponding KML file with a text editor, can find the line where the image is referenced (1).
What can be done here? Well at least two things.
First, and easiest, you can save a copy of the image generated as a JPEG image of type PNG, and then remove the white background that creates MapInfo. If you do not know how, read the tutorial Serif Photo Plus. Indeed, it is the JPEG image format that does not support transparency, and how GE Link saved in this format, there is nothing we can do. Then modify the KML file to point to this new image, type PNG with transparent background (simply by replacing JPG PNG). Okay, now the drive test is much clearer, and without having to use the resources of transparencies layer itself from Google.
Second, and lastly, you can make changes to the MB received. But should only do this if you know what you’re doing because it is not trivial task. You can for example remove the name Exported from Mapinfo Professional, and / or put the name of your company. You can also save as PNG directly. In future tutorials, we’ll learn more about Mapbasic, and soon you should be able to make their own modifications.
Speaking Mapbasic …
Mapbasic Speaking of, remember that at first we ask that you leave the window open while you were playing Mapbasic all commands? Well, here’s how it stayed.
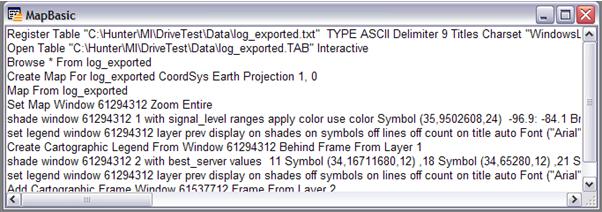
For most commands (unfortunately not all) who performed at the interface of Mapinfo, codes corresponding Mapbasic are shown. This facility helps us a lot, and soon we will be using as support the creation of scripts.
Conclusion
In this tutorial we learn what is basically a test drive, and how to plot the same data in Mapinfo and Google Earth. Learn to create thematic maps for ranges and for individual values. Also met some new concepts of Mapinfo, the selection of objects.
Far as into the MapInfo to Google Earth however, have specific modules, focused mainly on the automation, ie, the goal is to make the drive test, export the data to a file outgoing and ready - to run a macro that already make available the data ready for analysis, either in Mapinfo or Google Earth, thus eliminating also the time spent on repetitive tasks. We will see more detail in other tutorials on drive test in the future.
IMPORTANT : For now, continue assimilating the concepts of Hunter tool, and like all modules will be interconnected. See it quickly, and simplified plot the drive manually tests today, but the network data were available.
Download
Download Source Code: Blog_008_Drive_Test_Mapinfo_GoogleEarth.zip (395.0 KB)