Introduction
The geo-referenced analysis are widely used in the field of Telecom and IT. Up to now use some programs Access and Google Earth to facilitate the acquisition of geo-referenced data, but there are several other tools as good as these, and also widely used. This is the case for example of MapInfo, which still uses SQL and also has its own language automation - the Mapbasic. Today we will have our first contact with him, and some tips for using the program. Later we will return to using Google Earth and other tools, learning to get what they need to better facilitate our analysis and the work of day-to-day.
And there is something very important: learning to use the MapInfo, and becoming familiar with its interface, you’ll be familiar with tools for prediction and drive test, which generally follow the same concepts such as work areas, layers, etc…
Purpose
From the information of the data from our network, plot the data for Sites and Sectors in Mapinfo, and most importantly, learn how to use the program, plus some tips.
In this study, we will be viewing the basic applications for use of Mapinfo as an auxiliary tool in the activities of Telecom and IT. These applications involve, for example, graphic display of the plant cell, planning to Frequency Plan, analysis of Drive Testing and Verification of Network Performance (KPI’s).
Note: In most of the tutorials have the related files, which are sent to Subscribers.
If you are a subscriber, please verify your email address in the file Blog_006_Mapinfo_Network. zip. Use the support for any questions or issues you encounter.
If you are a member and have access to tutorial writing ever learn very important concepts that will surely help you in your own designs. You will confirm on every new tutorial.
File Structure
As usual, create a structure to contain the files that module.
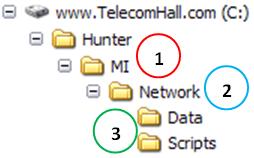
Hunter In the root directory, create the directory MI (1). Just below the IM directory, create the directory Network (2). Finally, create the directories below this directory Date and Scripts (3).
With the infrastructure ready, we can begin.
Preparing the data
The data can be processed by MapInfo can have several different origins, which makes this software very versatile.
Put simply, we have the information of coordinates and other information related to them, that define the graphic display of data. The formats can be as text, Excel and many others, but each specific format must be properly configured to represent the expected information.
We have data available in our network in the form of a table tbl_Network. One way of working would export two Excel spreadsheets from this table, one for sites and another for Sectors. And that’s what we do today, to learn some concepts for the use of MapInfo. Later we will see other ways of achieving the same result, including better ways to use automation via scripting.
In order to export the data to an appropriate form, we will use the Access file Hunter_MI_Network_RUN.mdb, located in the Scripts folder of the module MI Network. This file has linked to our table, two queries similar to those created to generate the data of sites and sectors in Google Earth (GE Network Module), and a macro to export data from query to Excel.
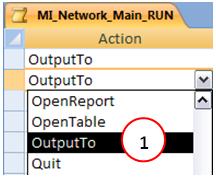
In Access, we created this macro MI_Network_Main_RUN. For it to export the data from each of the queries to Excel, defined as an action item OutputTo (1).
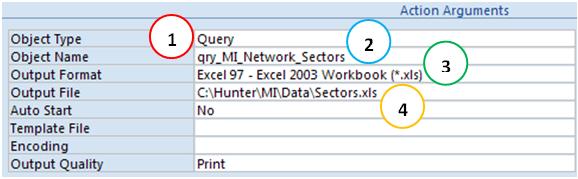
And the arguments of Action, we define what we want. In this case, to select Browse Object Type (1). In the Object Name, select the query you wish to export (2). Under Output Format, choose *. xls (3). And in the Output File, typed the filename, including path, which in our case is the Data directory module MI Network (4). There are other optional arguments, we can leave as is.
Note: Note that the macro will perform two actions, so we include two lines of actions OutputTo. In the arguments of the first sites to set up, and second, to Sectors.
Then execute the macro and generate the files MI_Network_Main_RUN Sites.xls and Sectors.xls in the Data folder of the module MI Network.
Opening or Importing table data
The first thing to do to work with the data in Mapinfo is to bring them into the same, and the options are open or import.
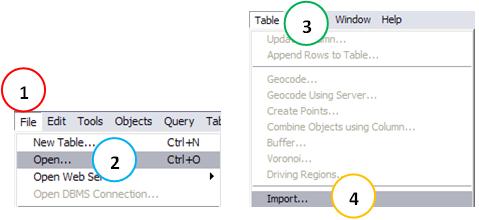
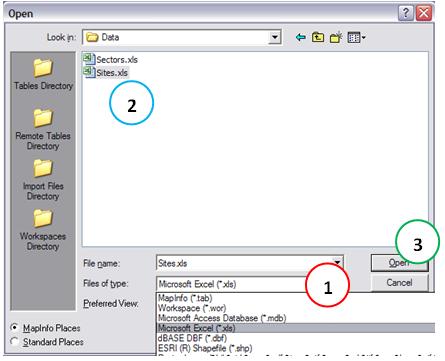
As information, there are two distinct paths, depending on the type of database. For files of type. Xls,. Txt,. Tab,. Jpg,. Bmp and others, we open them by selecting File Menu (1) -> Open (2). When the file type. Mif,. Dxf,. Bi,. Mmi,. Img and others should be imported through the Menu Table (3) -> Import (4).
In our case, we will open a table that is in an Excel file, or using the menu File -> Open as we speak up. In the dialog box, you change the File Type option (1) and Microsoft Excel 95 (*. xls), navigate to the file sites (2), then clicking the Open button (3).
NOTE: We will follow the procedure to plot the data in table Sites. Only after we open the table Sectors, to make it easier to follow.
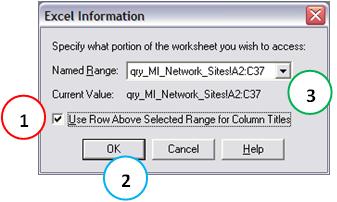
After clicking the Open button, a dialog box appears. It should inform how the data is available in our archive - what is the extent of the data, and if the first row contains the column headings. As we have just one query for each of the exported files, Mapinfo already identifies the extension. But we must inform you that the first row contains column headings, and no data. Thus, we mark the "Use the line above the range selected as column headings (1), and clicking the OK button (2). Note that in Present Value (3) we have the real extent of the data to be imported.
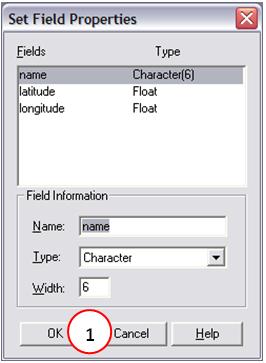
Again after clicking the OK button, there is another dialog box. Here we have the option to change some properties of the fields in our table, and the names and field types. The most important thing is to check if the MapInfo identified as type Double the fields that will be used in geo-referenced (latitude and longitude). If by chance had not identified, could then change. As everything is correct, simply clicking the OK button (1).
Sites After opening the table with the above procedure, the same is available in Mapinfo, even now is open for viewing.
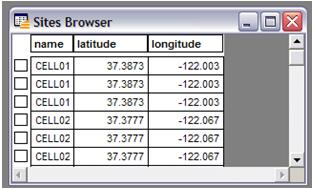
Note: Above are just viewing the table in the main area. You can close that display the X in the upper right corner of this table, but the table stays with the status of the Open MapInfo. Really close to a table, you must use the Menu option File -> Close Table.
This listing or table is a faithful copy of the data from Excel files, which will be used to display graphics.
Creating Sites Points
Okay, our data sites are already open by Mapinfo in tabular form. But the MapInfo does not know that there are fields that define latitude and longitude, much less what they are. Thus, and whenever we import tabular data containing geographic information, we need to tell MapInfo to create points using the fields that correspond to latitude and longitude at our table.
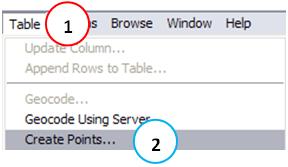
For that, we access the Menu Table (1) -> Create Points (2), where you select the table for which we create the point and directed to the MapInfo obtain information of coordinates that define the location of the elements of the map.
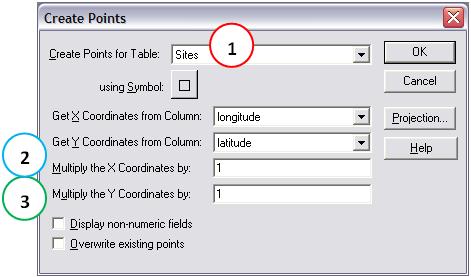
The geographic coordinate system uses the X axis for the definition of longitude and the Y axis for latitude. Moreover, it was standardized coordinates located to the east and north would be positive, and those located to the west and south would be negative. Thus the new dialog box Create points, we adjust the information. The table for which we create the points is the table Sites (1). Information as chose longitude coordinates X (2). And how we choose Y coordinate information latitude (3).
When we click the OK button, the window simply disappears, giving the impression that nothing happened. But the previous operation created the score for each pair of coordinates, only to visualize the data we need to create a map.
To create a new map, and view points of the sites, select Windows Menu -> New Map Window.
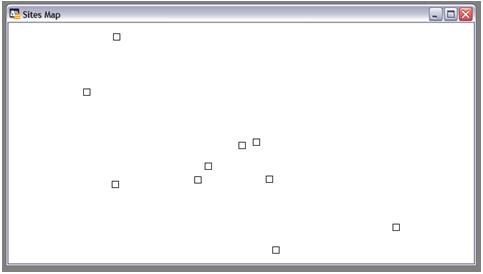
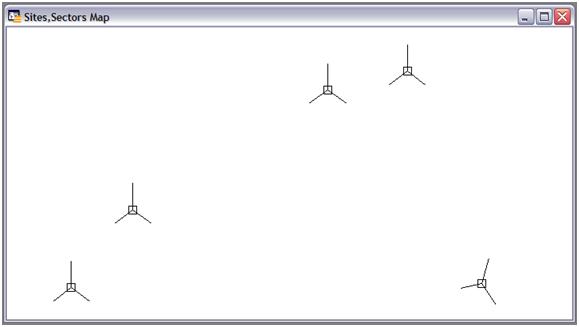
The window with the new map is then shown, with point identifiers of the elements on the map. Please note that this window was created automatically due to the fact that we have only one table open, and points created. Otherwise, it would open a dialog box asking from which table should be created the map.
The map shown allows a number of adjustments so that we can better visualize the data we have. Those are features of MapInfo, which will explore the use, for example zoom, changing brands, symbols, etc…
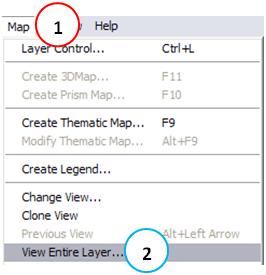
Some of these options are more specific and useful, as the option to view full level, which can be accessed via the Map Menu (1) -> Show Full Level (2 ) - or the menu of the right mouse button, then selecting the table for which we wish to see all points.
Layers
An important concept in Mapinfo is to view the information of maps as distinct layers or levels. Each layer behaves individually, with their attributes and individual controls. An analogy that we can do is to overlay transparencies. Each map window can contain any number of layers, and you can switch the sequence of overlap between them.
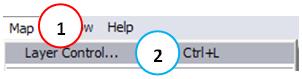
Layers Manager can be accessed via the Map Menu (1) -> Control Layer (2), or the menu right mouse button.
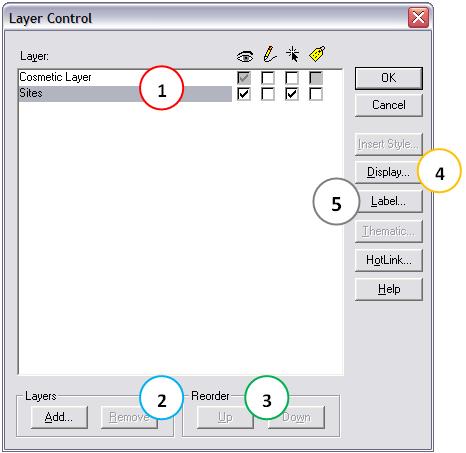
It is through the Layers Manager to alter the properties of each layer (1), remove or add new layers (2), and changed the sequence of the same (3). We can still change options Symbols and Colors (4) and text (5). We will see how to work with the Layers Manager in more detail at another opportunity.
Other Features
The MapInfo also has a slew of interesting features, such as the creation of thematic maps, ie, based on information from one or more points, make color adjustments, symbols, etc… In a simple example of thematic map, with an associated field value for example, we could plot the points with negative values with a red circle, and positive with a green symbol.
Another fantastic feature is the ability to use SQL to work with open tables, creating queries, or to filter /select data on the map.
But since today our goal is just to plot the initial data of sites and sectors of our network, and have their first contact with the Mapinfo, let’s get to talk more about Topic Maps, SQL queries, and other options in other opportunities.
Mapbasic
The Mapinfo has its own programming language, the Mapbasic. It is similar to Visual Basic, but unfortunately does not have a programming environment with as many features as the VBE environment, such as facilities to debug the code, running step by step by inspecting the value of each variable.
written codes are saved in files with the type MB, and the compiled code (executable by Mapinfo) are saved with the extension of type MBX. The environment to create the codes is similar to Windows Notepad, and we must do everything “by hand” at all. There is for example the option to “record macro”.
Still, there are powerful applications created in Mapbasic. The compiler is a program Mapbasic share, and must be downloaded separately. Soon we use Mapbasic in our system, then we will see in more detail.
Mapbasic in Mapinfo
When we try to plot the sectors in Mapinfo, there will be a problem: The geographical representation of the sectors, as we know, is a line. But how to create the lines? Believe me, the MapInfo has a way of doing this through its interface
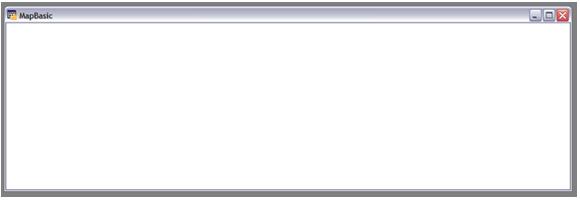
To achieve this, we use the Mapbasic. Luckily, we have at least a help when it comes Mapbasic. The MapInfo, through its main interface allows you to open a special window - the window Mapbasic. Menu Options -> Show Window Mapbasic or Menu Window -> Show Window Mapbasic.
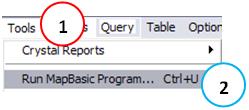
You do not need the Mapbasic installed to use Windows Mapbasic or to execute commands Mapbasic. Nor do you need to have installed to run programs Mapbasic Mapbasic (MBX), or you can run MBX files in Mapinfo. There is even an option for this Menu: Menu Tools (1) -> Run Program Mapbasic … (2).
Sure, but let’s not talk about programs Mapbasic today yet, so let’s continue and see how to do this using only Windows Mapbasic.
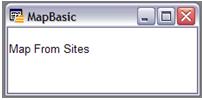
Mapbasic The window shows the syntax of all commands according to realize. With Mapbasic window open, choose Window -> New Map Window. A new dialog with a new map is generated. However, note that the window Mapbasic now no longer empty. We have the command syntax to open a new map window for the table Sites.
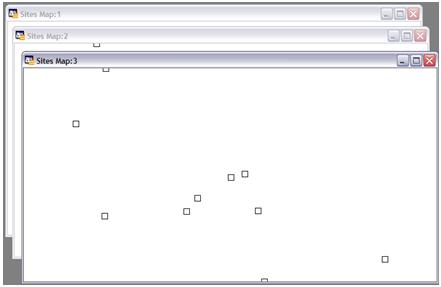
Now the most interesting: the reverse is also possible, ie if we know the command syntax Mapbasic, we can simply type in Mapbasic Window, select, and press the Enter key . On the desktop of Mapinfo Map 1 have now set up for initial demonstration. Map 2, created through the Menu, with the window open Mapbasic, to find out the syntax. E Map 3, created by Windows Mapbasic.
Building Industries on Mapinfo
Finally, we will create the sectors. First, we followed the same procedure used previously to make the Sites table, and opened the table Sectors, as well as Windows Mapbasic.
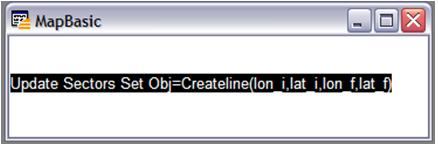
Then we must also create the points, using data of latitude and longitude of the site as it is to create action points that transforms each record (table row) in a geo object -referenced. Then we can then update this object, creating rows of sectors, executing the following statement in Window Mapbasic: Update Sectors Set Obj = Createline (lon_i, lat_i, lon_f, lat_f).
NOTE: We will see how to find this syntax Mapbasic to create lines, and many others, we shall see when we come to create our codes in Mapbasic.
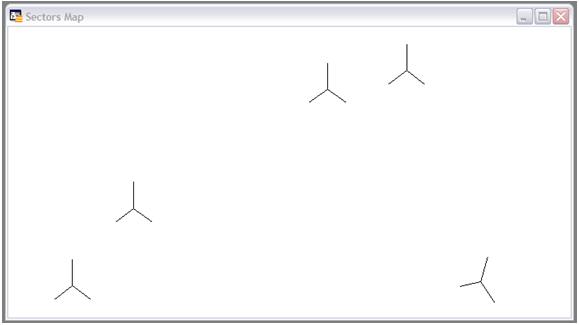
Pronto! Our sectors are plotted according to information from our original table.
Finally, use the Layer Manager, and leave only one Map window, containing the geo-referenced data for Sites and Sectors.
Saving our work
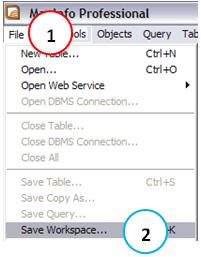
At any time, any information that our section or work area can be saved for future viewing. This process is accomplished through the File Menu (1) -> Save Workspace (2). In the future we can simply open the MapInfo and open our desktop, the data appear just as saved. Save as Mapinfo_Network.wor in the Data folder.
Conclusion
In this tutorial we had our first contact with the Mapinfo, a tool for geo-referencing important as good as Google Earth for our analysis. Learn how to create sites and Industries on Mapinfo, using the data from our table tbl_Network using only the interface of it. We also know the Mapbasic, which will be used in future tutorials.
Download
Download Source Code:Blog_006_Mapinfo_Network.zip (19.3 KB)