Introduction
The data from our network - sites and sectors - are already automatically plotted on Google Earth, so good. But the presentation of data can be much better. We saw how to change the characteristics of sectors and sites manually through the interface of the program. Today we will learn how to make a series of improvements that can be done to make this data much more organized and presentable.
Purpose
From the information of the data from our network, automatically generate a file that can be opened by Google Earth, an improvement of organization and presentation, as captions, brochures and information.
Today we see more exclusive tips such as clicking on the tip of an industry and get info on it.
NOTE: In the vast majority of the tutorials have the related files, which are sent to Subscribers.
If you are a subscriber, please verify your email address in the file Blog_005_Hunter_GE_Network (Legend - Folder - Info). zip. Use the support for any questions or issues you encounter.
If you are a member and have access to tutorial writing ever learn very important concepts that will surely help you in your own designs. You will confirm on every new tutorial
File Structure
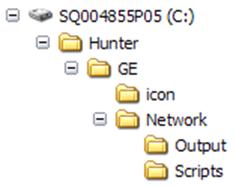
Let’s add the structure that we have to date the folder icon just below the folder GE. This folder is to assist, and contains all the auxiliary images as icons we use to improve the presentation of data. In this particular case, will contain the legend - an image file.
As for the files, we use the same name as the previous lesson (actually has the name Legend - Folder - Info in parenthesis, only to indicate that the sample file from this tutorial; so for example you can compare what’s new in relation to the sample file of the previous tutorial). You can simply overwrite the current files with new ones, which only contains more data and codes. Anyway, the original files of each lesson are available and you can make the download them whenever you want.
We already have the structure, let’s begin.
Legend
Using Google Earth is not possible to directly insert a caption, so you can not reverse the inspection as we did until now, and check what is the syntax that we use.
For that we need or get a sample file that already contains the legend - and then reverse the inspection, or search the Google documentation on this syntax.
Anyway, we already have the syntax to create a caption (ScreenOverlay). The name tag (1) definine the name of the Legend, and href tag (2) sets the image that will be used as caption.
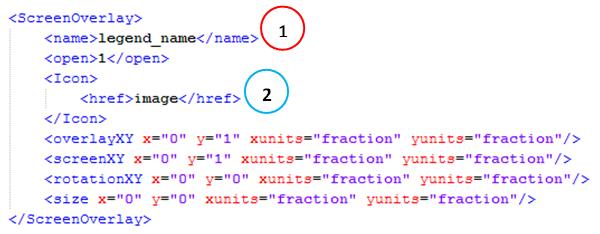
The other tags control the positioning. At the moment did not revise because we want the legend in the upper left corner.
Thus, having available for use as a photo caption, we can create it through code.
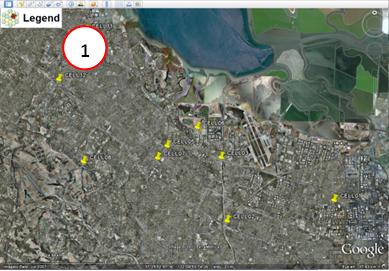
Using standard image file supplied our archive of Google Earth now displays its caption (1) overlapped
Folders
Following the procedure done today to generate Google Earth files, we would have a file generated for the Legend, and our data thus far are as shown below.
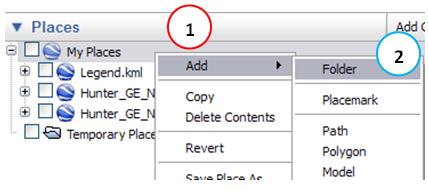
This form until it works, but certainly not the most elegant, or even more organized. The ideal would be to have just one folder - Hunter_Network - containing all with ours, since they are related. Thus, through Google Earth, create a new folder to contain these data. Add Menu (1) -> Folder (2).
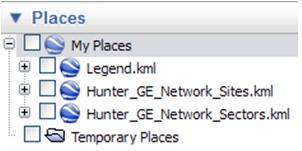
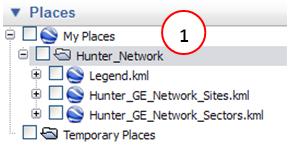
Dragging each of the three files to the new folder you created, we have the final structure. Now, just click on the folder Hunter_Network (1) to show the sites, sectors and the caption at once. Contrary to hide.
Saving our folder as a KML file, we find a text editor with the syntax for folders, and how to set the name of it, using the name tag (1).
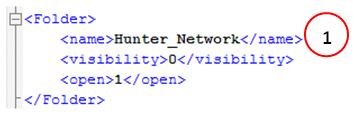
The tag visibility defines whether the folder is visible or not, and tag sets to open the folder should be shown as open or closed.
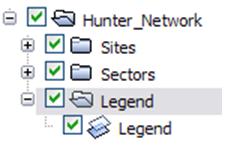
So now we have our data organized into folders.
Info Window
One great feature we have in Google Earth is that we can click on a marker, and obtaining the information stored in the Description field (1) of the same.
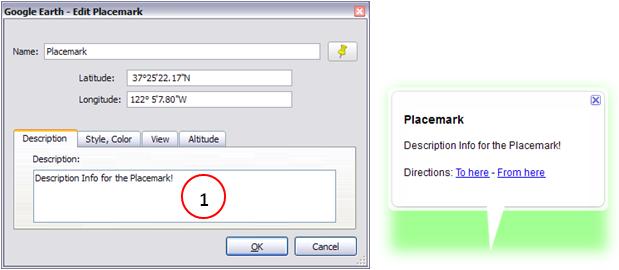
The syntax for including the description on the label is simple and defined by the tag description.
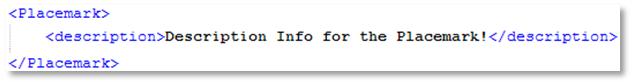
Okay, for the sites simply add this line just below the name tag that defines the label name.
But a line is not clickable in Google Earth, then how do we get clicking on the edge of the industry? We have a little problem
The solution that comes immediately is simple: we plot also an additional marker at the tip of the sector. Except that here we have a new problem: if we do, icons will appear at the tip of the sector, which is not interesting.
To resolve this problem, we’ll learn a little more structure KML, before we proceed.
A very cool that we will see, is the power to declare styles, with a number of properties. And then apply this style to the placemark you wish.
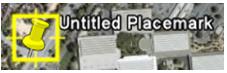
For example, if we add just one point, he becomes the default. With the command corresponding to “Add a point”, we have something like the figure below.
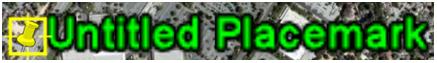
But we can add a point specifying the details of it, ie, its properties such as color, icon size, text color, etc… That is, we can execute the instruction corresponding to “Add one point, with the label size 2, and with the color green!” Then I would be as shown below.
But that alone is not sufficient for our case.
Fortunately, we can set the default style, and style when you hover over the marker
So just set something like the normal style (no mouse over the marker), place all the values at 0 and all the transparent colors, style highlight (when mouse over the marker), show the text value 2 - for example.
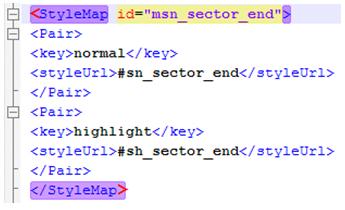
So that’s it. Just define a style and apply it to bookmark that included the tip in the industry! There are a number of properties, and set them to follow the same concept of KML tags.
define the name of our style as sector_end as we see below.
And for each of the two types (normal and highlight), we define what should be the properties. Below is a property of LabelStyle scale (scale of style of text) to the normal type, ie, the text size zero
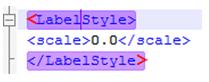
All text and icon properties are set appropriately in the code, and are commented.
Following the code you’ll see that included a new marker on the edge of each sector, with the applied style.
Open the file created, and check how far you can click on the tip of the sector, and obtain information from it
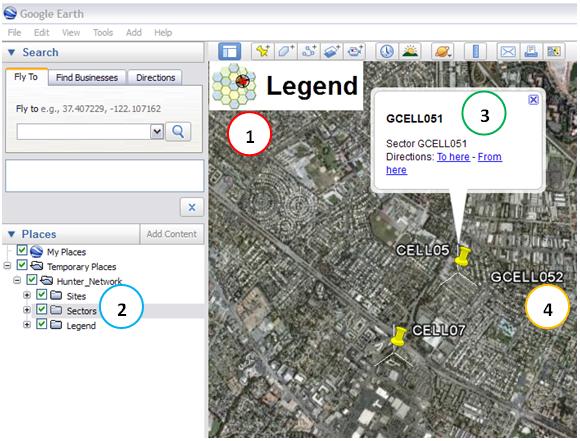
Our final file now has a caption (1), allows us to select all at once - or not (2), and when we clicked on the edge of a sector, we have the information the same (3), according to what we choose to show, in which case the text was followed by their initials Sector. Also note that simply by hovering over the end of the sector showed its acronym (4).
The use of styles will be easily explored from here. You’ll find that using styles in a creative way and achieve impressive results
Conclusion
With this lesson we learn how to use VBA code in Access to make some adjustments on our Google Earth file format, not many of them simply impossible to be made using the program interface. We saw how to add captions, organize data into folders and retrieve data from a sector by clicking on their end
Hope you enjoyed. Ask any questions posting your comments in the blog or via our Support via Chat or Email.
Until our next meeting and remember: Your success is our success !
Download
Download Source Code: Blog_005_Hunter_GE_Network_(Legend-Folder-Info).zip (32.8 KB)