Introduction
Plot the data from our network of sites on Google Earth has been the beginning, and we had our first contact with the way this is done. Equally or more important that information from websites is the information sector, however, is viewing the sectors of our BTS’s.
Purpose
From the information of the azimuth of the antennas in each sector, automatically generate a file that can be opened by Google Earth, with lines indicating the direction of it.
Because Hunter uses lines instead of polygons to represent images or sectors? Well, first it is important to know that it is possible to create sectors with this kind of illustration (in the future to do so), but the lines have some advantages. For example, when we have more than one technology in our network (currently we are working with dummy data examples GSM only), the sectors of all technologies can be viewed at the same time, coloring the lines of each technology with a different color, easily compare the different azimuths. Another advantage is that the line loads much faster on Google Earth. And agility is never enough.
NOTE: In the vast majority of the tutorials have the related files, which are sent to Subscribers.
If you are a subscriber, please verify your email address in the file Blog_004_Hunter_GE_Network (Sectors). zip. Use the support for any questions or problems you encounter.
If you are a member and have access to tutorial writing ever learn very important concepts that are sure to help you in your own designs. You will confirm on every new tutorial.
File Structure
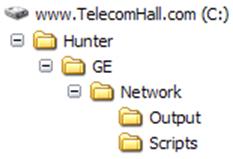
This time there will be no need to create new folder to put the files that we use. This is because the module will continue working with GE Network, and has created the structure of that advance.
As for the files, we use the same name as the previous lesson (actually has the name Sectors in parenthesis, only to indicate that the sample file of this tutorial, so you can by example to compare what’s new about the tutorial sample file anteriorly). You can simply overwrite the current files with new ones, which only contains more data and codes. Anyway, the original files of each lesson are available and you can make the download them whenever you want.
We already have the structure, let’s begin.
A little bit of Math
Our goal today is to generate the sector-shaped lines. To generate a line, you need two points, its angle and length. But the only information we have are the starting point (latitude and longitude of the site) (1) and angle (azimuth antenna) (2).
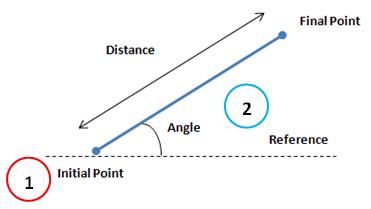
Our distance is a constant - all sectors should have the same size. Then, using the math we find another point
Our data are thus required:
- lat_i : initial latitude of the sector. LAT_DEC field of our table
- lon_i : starting longitude sector. LON_DEC field of our table
- angle : angle of the sector. ANT_AZIM field of our table
- sector_len : constant value defined for a given length in the industry
- lat_i : latitude end of the sector. Calculated field = [lat_i] + sin ([angle] * pi/180) * sector_len
- lon_f : the end of the longitude sector. Calculated field = [lon_i] + cos ([angle] * pi/180) * sector_len
So we need to know how to add these calculated fields that our consultation will be created with all data necessary to generate the output file.
Create a calculated field in a query is very simple and very similar to how we change the names of table fields for most representative names. The syntax is the same, simply enter the name of the calculated field, followed by “:” and the calculation expression, that our case was shown above. Only one difference is that we need to change the totals row, stating that now the field is calculated through an expression.
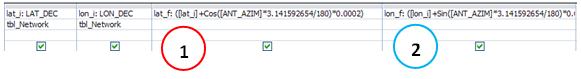
Thus, we must create our query and include the fields with information on latitude end of the sector (1), the calculated field:
lat_f : ([lat_i] + Cos ([ANT_AZIM] * 3.141592654 / 180) * 0.0002)
And also for the information of longitude end of sector (2), the calculated field:
lon_f : ([lon_i] + Sin ([ANT_AZIM] * 3.141592654 / 180) * 0.0002).
Note that we define the constant value sector_len as 0.0002. This value will result in a distance of 200 meters. Changing this value, you change the size of it. And to use the value of PI 9th decimal places.
The new fields to our query look like.
And the result of query execution so.
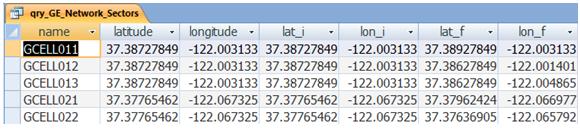
Note that there was no need to use the field as ANT_AZIM output field, although it has been used in the calculations.
Creating the code
In this lesson we are changing the code previously created sites to plot. We need to plot the industry like a line, then first thing to do is check how the format of Google Earth for lines. Using the same procedure reverse - to create a line on Google Earth, export, and inspect the generated file, we see that the line is defined by the tag LineString (1). The start and end point coordinates are between tags (2), as seen below.
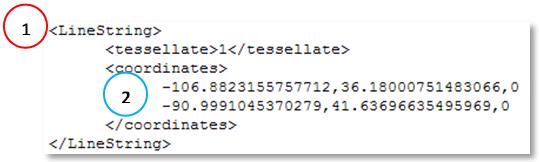
Again we are not concerned now with the altitude (just after the zero latitude, longitude), because this information is not applicable at this time.
The complete code to generate our archive, containing all changes that lesson is available in the file that you downloaded earlier in this tutorial.
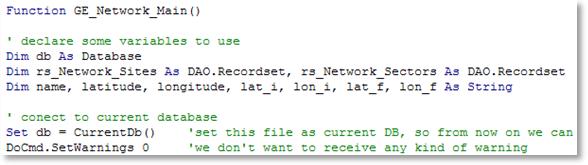
All code is commented, and we suggest that you read it.
Running code
Finally, we run the code through macro that is already created.
The way that the macro created in the previous lesson we received no confirmation that the file had been created. But we can include more action in our macro, to be held after the code runs, and report through a remote standard Windows message that the processing ended.
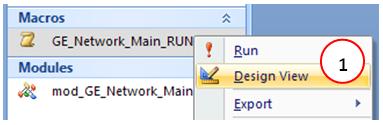
So we changed the macro created right-clicking on it and choosing Design (1).
On the second line have included a new action: Message Box (1).
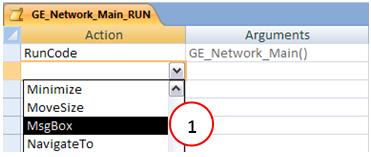
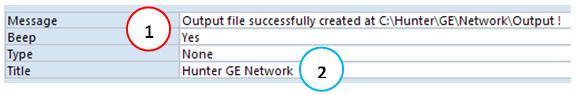
And the arguments of this action, we typed our message that the code was executed, and the file created: "Output file successfully created at C: \ Hunter \ GE \ Network \ Output "(1). To improve the communication interface, put the name of the textbox as "Hunter GE Network (2).
Finally, save the macro, keeping the same name.
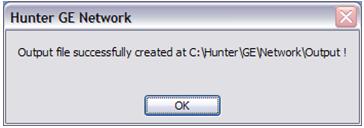
Pronto. With a double click, execute the macro, which calls the code - first action we have indicated, and when you finish running, it shows a message box as defined.
Open the file created, and check how the websites of our network and sections were plotted on Google Earth.
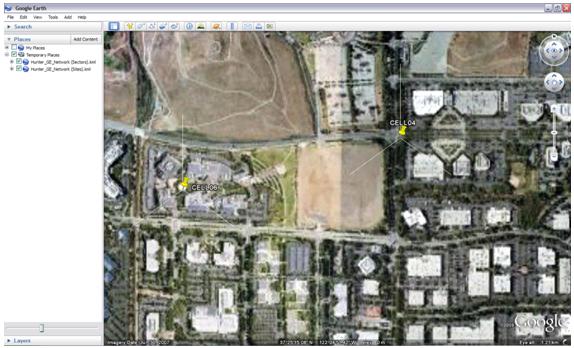
We are moving and can not even look, but we have created a complete program that already does what he can not do through the interface of Google Earth, such as creating sectors. Is still simple, we have no doubt. But it is something that many people can not do.
Note: From now on we will be increasing our pace a bit with tutorials. So it is VERY important that you understand well what has been shown so far, and has managed to reproduce and understand all the codes (see that until now fairly simple!). Please advise if by chance you can not follow, for more specific help on your questions.
Besides there are some details that are not shown on purpose. Let’s take an example: the code might already have been written with one function call other sub-functions. No doubt, we will do that soon. But is that it is easier for those who never wrote a macro, and the organization understand the gains that we have when we do that.
Another thing, our application is still very simple - nothing happens when we click on the markers, etc… This is also deliberate. In the next tutorial we’ll see how to professionalize and finalize our application (with subtitles, clicks, folders, etc. …).
So: understand all the basics that was shown so far, to evolve more from now. Any problem: support
Conclusion
With this lesson we learn how to use code in Access to create lines, that our case serves to indicate the direction (Azimuth Antenna) sectors of our network, a file in the Google Earth.
Hope you enjoyed. Ask any questions posting your comments in the blog or via our Support via Chat or Email.
Till our next meeting and remember: Your success is our success!
Download
Download Source Code: Blog_004_Hunter_GE_Network_(Sectors).zip (19.5 KB)