Recently, I came across how Uber uses the H3 hexagonal indexing system to divide the entire world into precise, uniform cells for pricing, demand prediction, routing, and real-time geospatial analytics. The idea fascinated me — especially how something as simple as a hexagon could make complex location problems easier and faster.
So I decided to learn the H3 algorithm from scratch, break it down visually, and simplify it in a way that anyone — engineer or not — can understand. This post is my attempt to share that journey, along with the diagrams that finally made everything click for me.
Introduction
In this post, I’m going to walk you through the H3 algorithm, a powerful geospatial indexing system developed by Uber. We’ll explore why H3 uses hexagons, how it works, and why it can be more effective than traditional square grids for certain geospatial tasks.
What is H3?
Modern location problems, from finding the nearest driver to aggregating demand by neighborhood require a spatial system that is fast, consistent, and easy to reason about. H3 (Hexagonal Hierarchical Spatial Index) is an open-source geospatial indexing system created at Uber that does exactly that: it divides the world into hexagonal cells at multiple resolutions, and encodes each cell into a compact 64-bit identifier.
Press enter or click to view image in full size
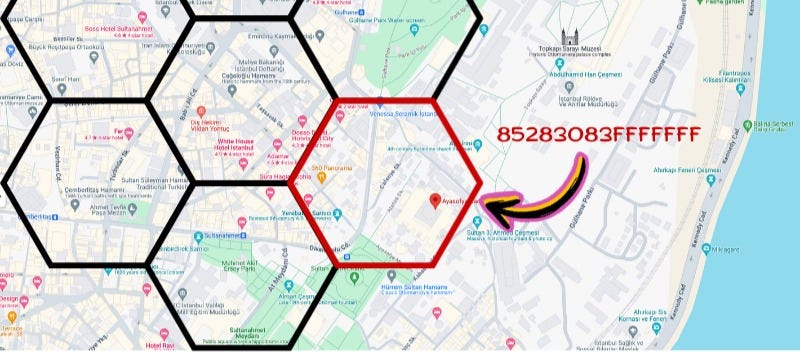
Shows how Hexagon are mapped on to the map
Why H3 and not quadtree ?
Hexagons are used in H3 because they create one of the most balanced and uniform grids for mapping. Each hexagon has six neighbors at equal distance, which makes movement, clustering, and density calculations smoother and more accurate.
Squares (like geohash or quadtree grids) have uneven neighbor distances and distort heavily as you move across the map, especially near poles. This causes inconsistent aggregations and unstable ML signals.
Hexagons minimize these distortions, preserve area more uniformly, avoid diagonal inconsistencies, and produce cleaner, more natural-looking spatial clusters — making them ideal for geospatial indexing systems like H3.
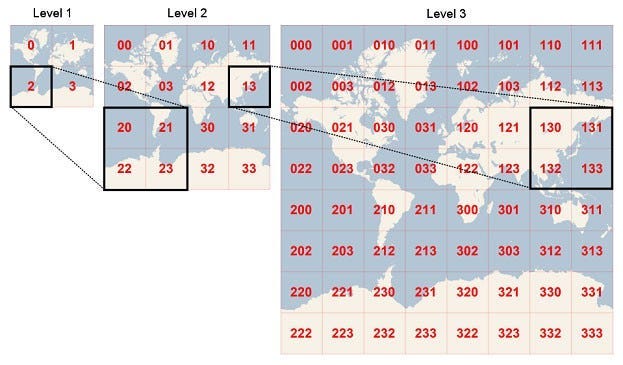
Quadtree Mapping
How H3 Works
H3 divides the entire Earth into a grid of hexagons at different resolutions.
Each resolution represents a different level of detail:
- Low resolution → large hexagons (country-level)
- High resolution → small hexagons (street-level
At every step, each hexagon can be subdivided into 7 smaller hexagons.
This creates a hierarchical system, where every hexagon has:
- a parent (larger hex)
- children (smaller hexes inside it)
Each hexagon is assigned a 64-bit hexadecimal ID that uniquely identifies:
- its resolution, its position on the globe, its parent level
So when you convert a latitude/longitude to H3, you’re simply asking:
- “Which hexagon at resolution r contains this point?”
And when you expand that hexagon to a higher resolution, you get its children.
Press enter or click to view image in full size

Press enter or click to view image in full size
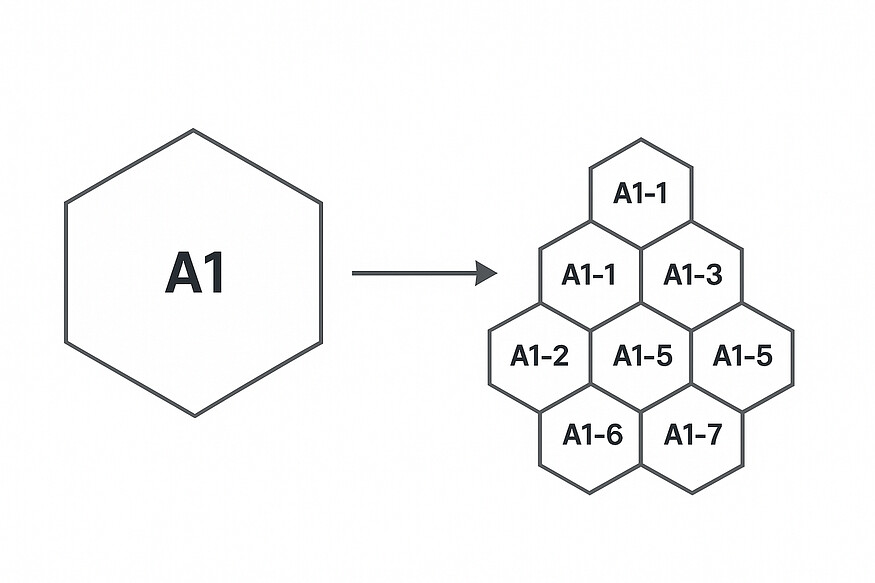
Just for an example I have shown the mapping as A1 , A2 but its 64-bit hexadecimal ID, Eg: 8f28308280fffff
Get Sudarshangampa’s stories in your inbox
Join Medium for free to get updates from this writer.
Subscribe
Now imagine these above Hexagons on the map below
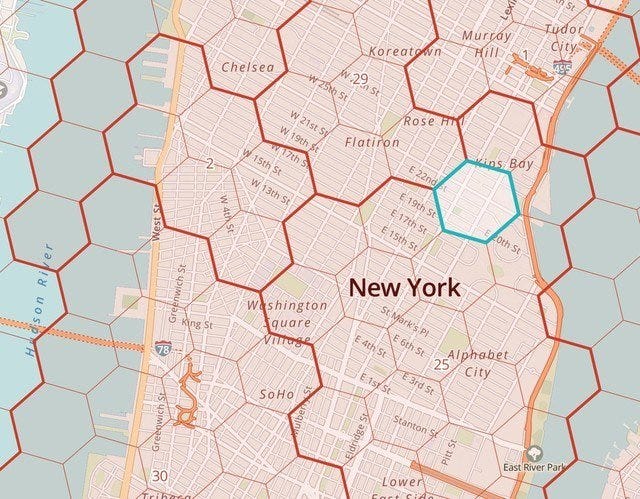
Larger hexagons subdivided into smaller ones
In practice, this lets systems like Uber:
- group data by region
- do fast proximity searches
- aggregate demand
- predict traffic
- build clean heatmaps
- track nearby points (nearby drivers)
H3 works by projecting the Earth onto an icosahedron and dividing it into a fixed set of large “base cells.” Each of these cells is then recursively subdivided into smaller hexagons across different resolutions, creating a clean hierarchical structure. Every hexagon is represented as a 64-bit index that encodes its location, resolution, orientation, and its relationship to its parent cells. Because the index contains all the necessary information, H3 doesn’t store grids or polygons — it simply calculates a hexagon’s boundaries, neighbors, parent, or children on demand using mathematical transformations. When you call functions like geoToH3, H3 converts a latitude/longitude into the correct icosahedron face and walks down the hierarchy to the requested resolution. Similarly, operations like h3ToChildren, h3ToParent, and kRing are computed instantly by decoding the index and moving within the hexagonal coordinate system. This design makes H3 fast, lightweight, extremely scalable, and consistent across the entire planet—all without needing a database of shapes or precomputed tiles.
Practical Uses of H3 (Why All This Actually Matters)
Once you understand how H3 generates hexagons, stores them as 64-bit indexes, and lets you move up or down the hierarchy, the real power becomes clear: you can treat the entire world as a uniform grid. This makes spatial analysis dramatically simpler. For example, ride-sharing apps like Uber or Ola don’t compare raw latitudes and longitudes when looking for nearby drivers — they convert both the rider and driver locations into H3 hexagons and instantly know which ones fall into the same cell or neighboring cells. This removes complex geometry and allows fast matching, clustering, demand prediction, heatmaps, surge pricing, and even routing decisions.
Delivery platforms use the same idea to group orders, telecom companies use hexagons to analyze signal coverage, and city planners use them to understand traffic flow or population density. Because every hex is a consistent, fixed area at a specific resolution, aggregating or comparing data becomes as easy as grouping by hex ID. And thanks to the parent–child hierarchy, the same data can be analyzed at a neighborhood level, street level, or block level with just one line of code.
Final Conclusion
Whether you’re building a ride-sharing platform, analyzing delivery patterns, or experimenting with geospatial ML, H3 gives you a consistent way to work with location data at any scale.
H3 takes the complexity out of geospatial work by giving us a simple, global, hexagon-based grid — one that makes mapping, clustering, and real-time decision-making far more efficient and intuitive. Once you start thinking in hexagons instead of raw coordinates, the entire world becomes easier to understand.