Hi Experts.
How do I read these KPIs in LTE?
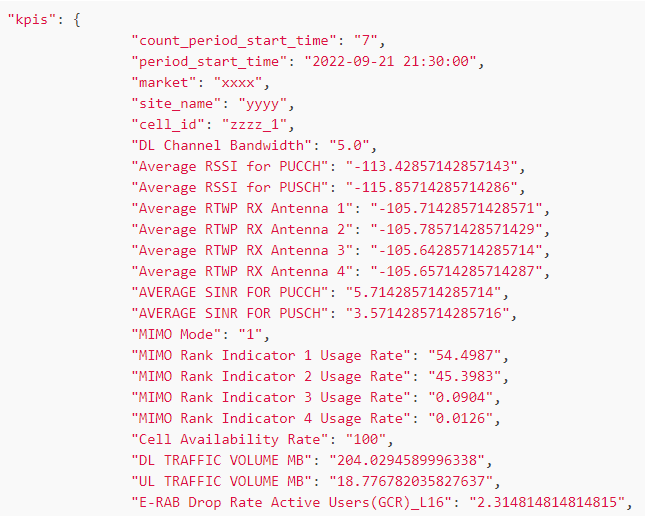
"kpis": {
               "count_period_start_time": "7",
               "period_start_time": "2022-09-21 21:30:00",
               "market": "xxxx",
               "site_name": "yyyy",
               "cell_id": "zzzz_1",
               "DL Channel Bandwidth": "5.0",
               "Average RSSI for PUCCH": "-113.42857142857143",
               "Average RSSI for PUSCH": "-115.85714285714286",
               "Average RTWP RX Antenna 1": "-105.71428571428571",
               "Average RTWP RX Antenna 2": "-105.78571428571429",
               "Average RTWP RX Antenna 3": "-105.64285714285714",
               "Average RTWP RX Antenna 4": "-105.65714285714287",
               "AVERAGE SINR FOR PUCCH": "5.714285714285714",
               "AVERAGE SINR FOR PUSCH": "3.5714285714285716",
               "MIMO Mode": "1",
               "MIMO Rank Indicator 1 Usage Rate": "54.4987",
               "MIMO Rank Indicator 2 Usage Rate": "45.3983",
               "MIMO Rank Indicator 3 Usage Rate": "0.0904",
               "MIMO Rank Indicator 4 Usage Rate": "0.0126",
               "Cell Availability Rate": "100",
               "DL TRAFFIC VOLUME MB": "204.0294589996338",
               "UL TRAFFIC VOLUME MB": "18.776782035827637",
               "E-RAB Drop Rate Active Users(GCR)_L16": "2.314814814814815",
               "Total VoLTE Drops": "0",
               "VOLTE ERLANG": "0",
               "Active QCI1 ERAB": "1",
               "Setup Success Rate": "-100",
               "RRC_CONNECTED_UE_AVG (M8051C55)": "0.5",
               "RRC_CONNECTED_UE_MAX (M8051C56)": "5",
               "RACH Setup Completions Failure Rate": "13.267148014440437",
               "VoLTE Access Failures (GCR)": "2",
               "VoLTE Access Failure Rate (GCR)": "1.5151515151515156",
               "Volte Drop Rate(GCR)": "0",
               "Inter-Frequency HO Success Rate": "88",
               "Intra-Frequency HO Success Rate": "88",
               "LTE Data Access Failure Rate GCR": "1.5151515151515156",
               "VoLTE Calls": "1",
               "Total VoLTE Drops L16": "0",
               "VoLTE Access Failure Rate - old": "1.5151515151515156",
               "RACH STP Attempts": "2728",
               "Initial E-RAB Setup Failure Rate": "0",
               "Average UE DL Throughput": "12964.552516983103",
               "Average UE UL Throughput": "614.5495756519064",
               "DL PRB Utilization (PCT)": "16.012371428571427",
               "UL PRB Utilization (PCT)": "6.560107936507936",
               "CCE Blocking Pct (PCT)": "0.0496"