Hello,
Does anyone know how to plot this on Power Bi?
Power BI does not have this capability. Power BI is not like a standard GIS tool (MapInfo, QGIS). I tried to plot by making the cell style in MapInfo first, then converted the tab file into json to load into Azure map in PBI. But that did not work. I would suggest you to use QGIS as long as PBI does not develop this capability (not sure if it will ever be done in the near future). You can raise an issue in PBI community for this feature.
Hello there is one way to have that kind of maps using the WKT polygons and the visual “Iconmap”, here is an example:
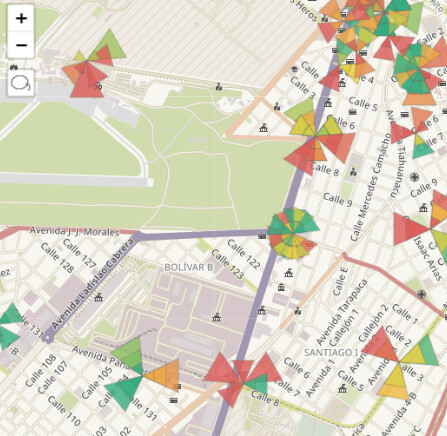
once you have the WKT you can draw any KPI on the cells.
Regards,