In wireless network planning, the difference between deploying capacity upgrades strategically versus reactively can mean millions in saved capital expenditure. The challenge? Identifying precise capacity thresholds where real users experience degradation—not just theoretical limits.
The Problem:
Traditional capacity planning often relies on oversimplified thresholds. But 5G NR networks are complex: different bandwidths, spectrum bands, urban vs. rural deployments—each behaves fundamentally differently. Without data-driven precision, you risk either:
• Under-investing (degraded user experience, churn)
• Over-investing (wasted CapEx on premature upgrades)
My Solution:
I developed a big data methodology that analyzes hundreds of millions of KPI samples to distinguish between three critical failure modes:
 Coverage-Limited Cells → Users far from the tower experiencing low throughput (requires new sites or antenna optimization)
Capacity-Limited Cells → Users close to the tower but experiencing degradation due to resource contention (requires spectrum addition)
Scheduler-Limited Cells → PDCCH blocking despite available PRBs (requires parameter optimization or carrier addition)
The Technical Approach:
Using AWS infrastructure, I processed 6 months of network-wide ROP-level KPI data, creating two analytical frameworks:
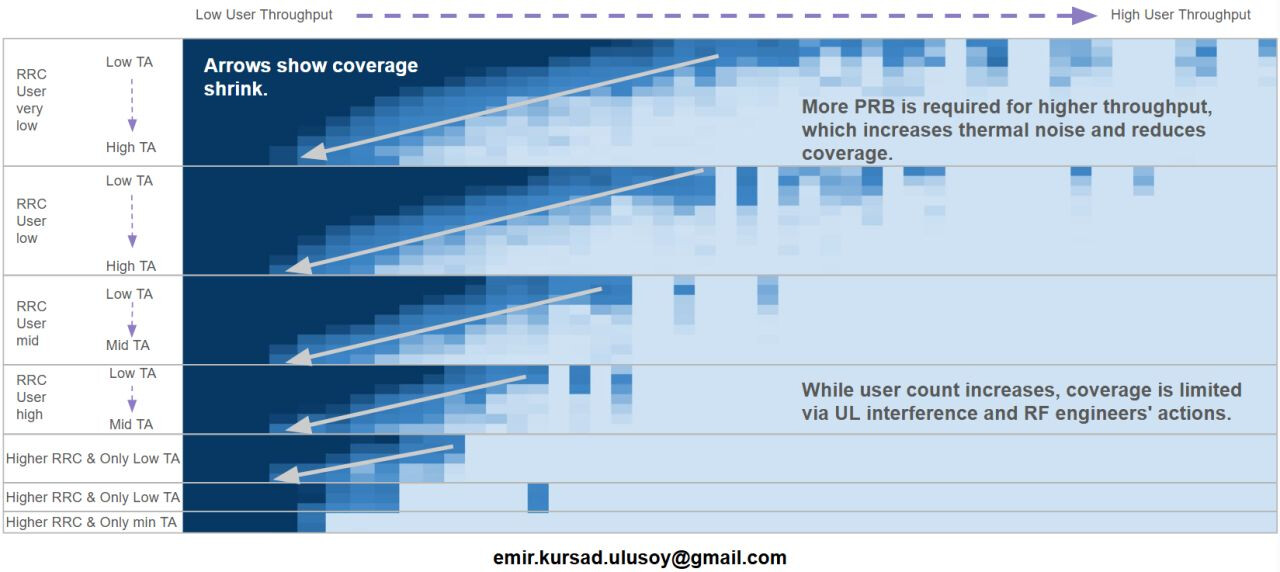
Table 1 - Demand Side Analysis:
Cross-referencing RRC users × Timing Advance × User Throughput to reveal how coverage distance and user count interact. This transforms theoretical link budgets into empirical validation based on real customer experience.
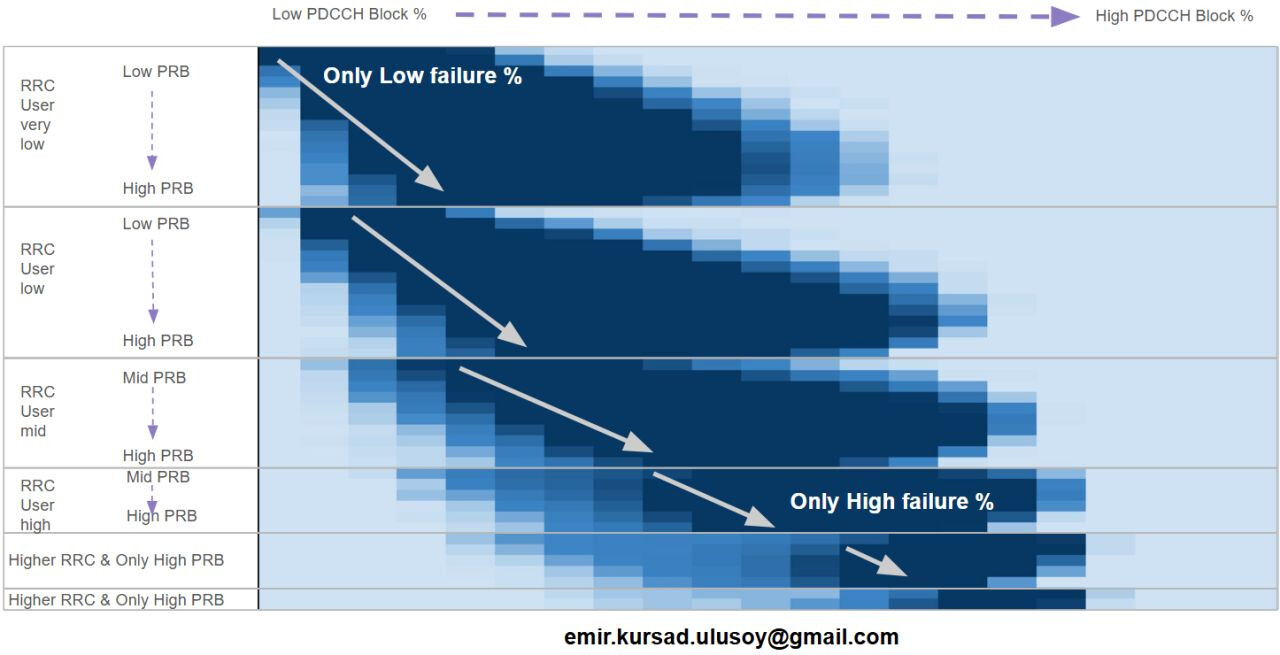
Table 2 - Supply Side Analysis:
Analyzing RRC users × PRB Utilization × PDCCH Blocking to identify scheduler capacity limitations—a critical bottleneck in 5G NR that emerges even before spectrum exhaustion, especially on narrow bandwidth cells.
The Impact:
This isn’t theoretical—it’s been validated on live production networks. By distinguishing root causes through cross-table pattern recognition, network teams can:
• Prioritize capacity investments where they’ll have maximum impact
• Avoid unnecessary site builds in user-count-limited scenarios
• Optimize existing infrastructure before adding hardware
• Justify multi-million dollar budget decisions with data-driven confidence
The Foundation:
Critical prerequisite: Any cell with VSWR issues, PIM problems, hardware alarms, sleeping cells, parameter discrepancies, etc. must be fixed FIRST. A single misconfigured PLMN can cascade traffic to neighbors, creating false capacity signals.
Linkedin: 