Field Tools: Turning Drive Test Logs into Something You Can Reason About.
Raw field logs are hard to interpret in isolation and putting them on a map makes patterns visible very quickly.
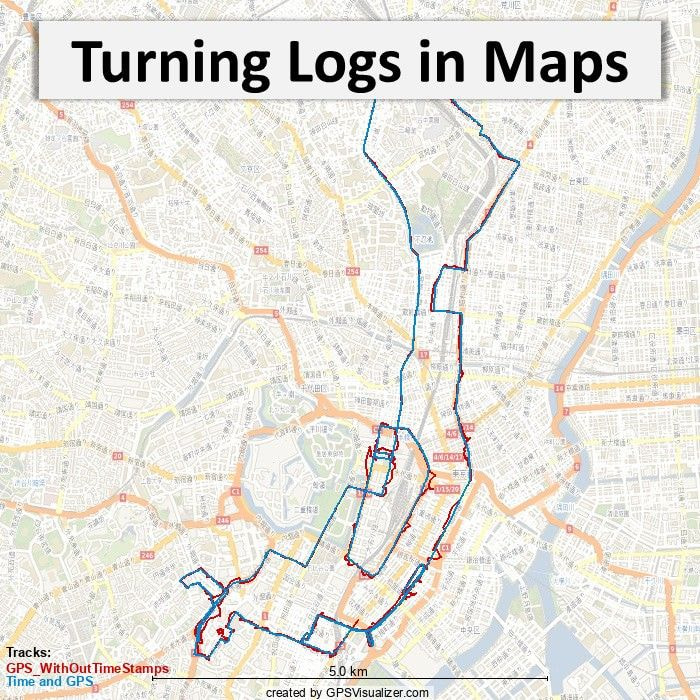
Here, GPS Visualizer is used to help plot an urban drive route from field logs:
- Route length and repetition become obvious
- Complex paths replace the idea of a simple A→B “drive test”
- Becomes much easier to correlate network behaviour with location
Simple tooling, but very effective when you’re trying to explain what actually happened during a field test.
LinkedIn: ![]()