Ever wondered how data moves through a network?
-
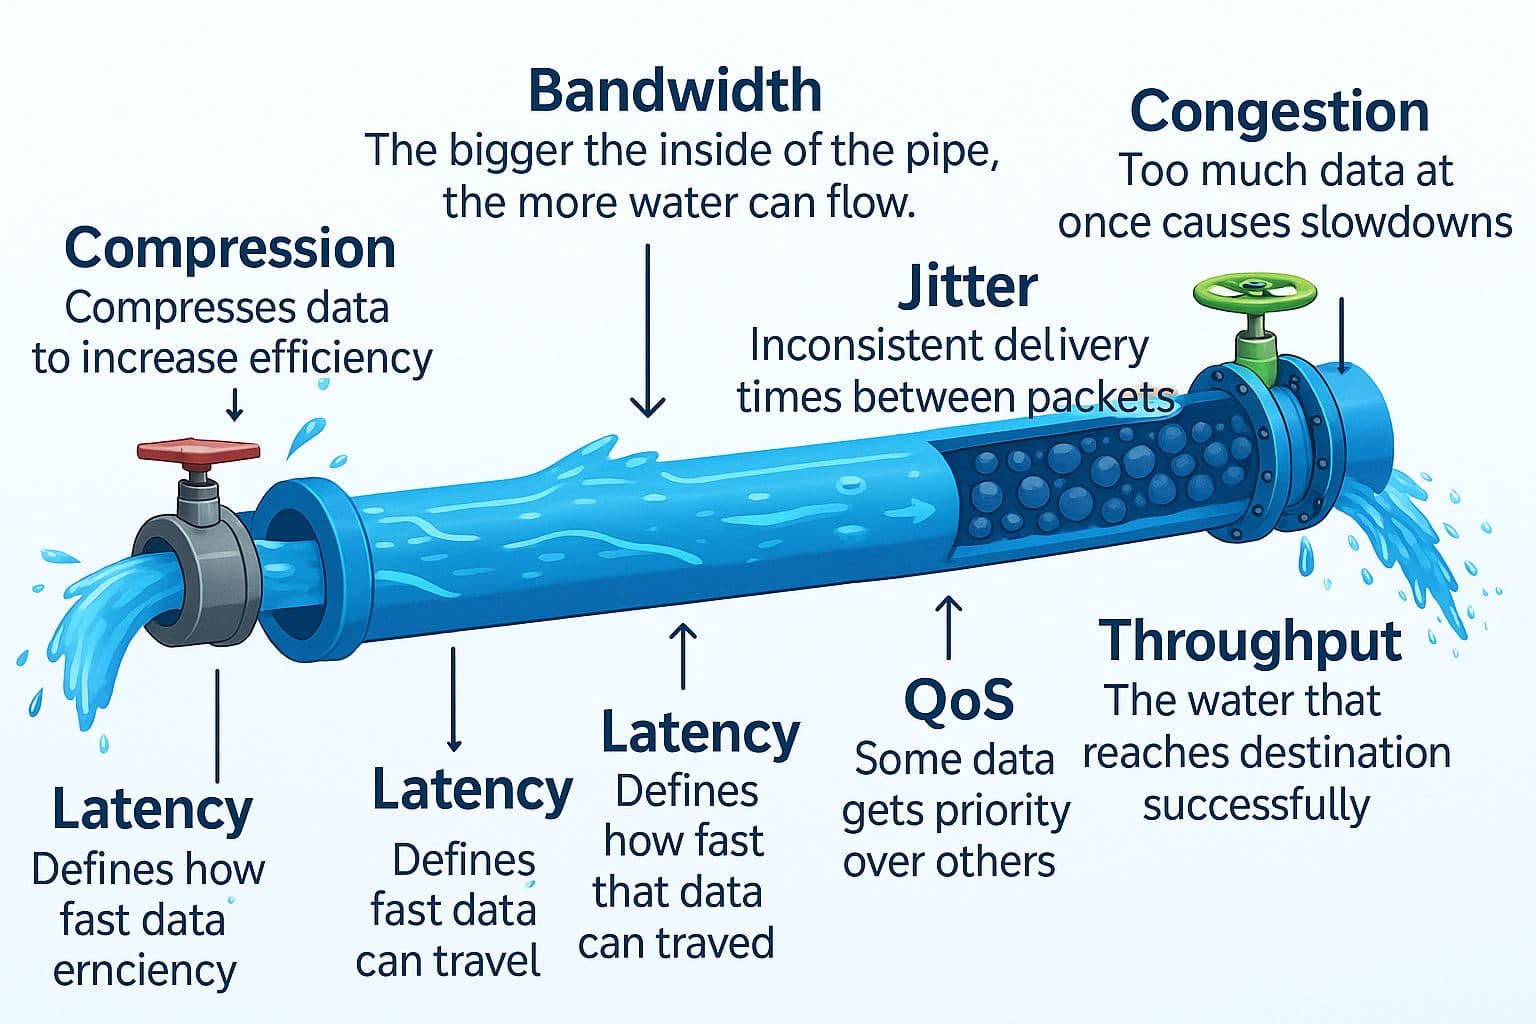
Here’s figure uses a pipe and water analogy to explain key network performance concepts:
- Data: Represented as water entering the pipe — symbolizing the flow of information.
- Bandwidth: Shown as the diameter of the pipe — the maximum capacity of data that can pass through.
- Throughput: Water successfully exiting the pipe — the actual amount of data received.
- Latency: Indicated by the pipe’s length — the time it takes for data to travel from source to destination.
- Packet Loss: Shown as water leaking from cracks — data lost during transmission.
- Jitter: Uneven flow — variability in data arrival times.
- Congestion: Clumped water/data inside the pipe — caused by too much traffic.
- Firewall/Filtering: A mesh blocking contaminants — simulates security filtering harmful or unauthorized data.
LinkedIn: ![]()