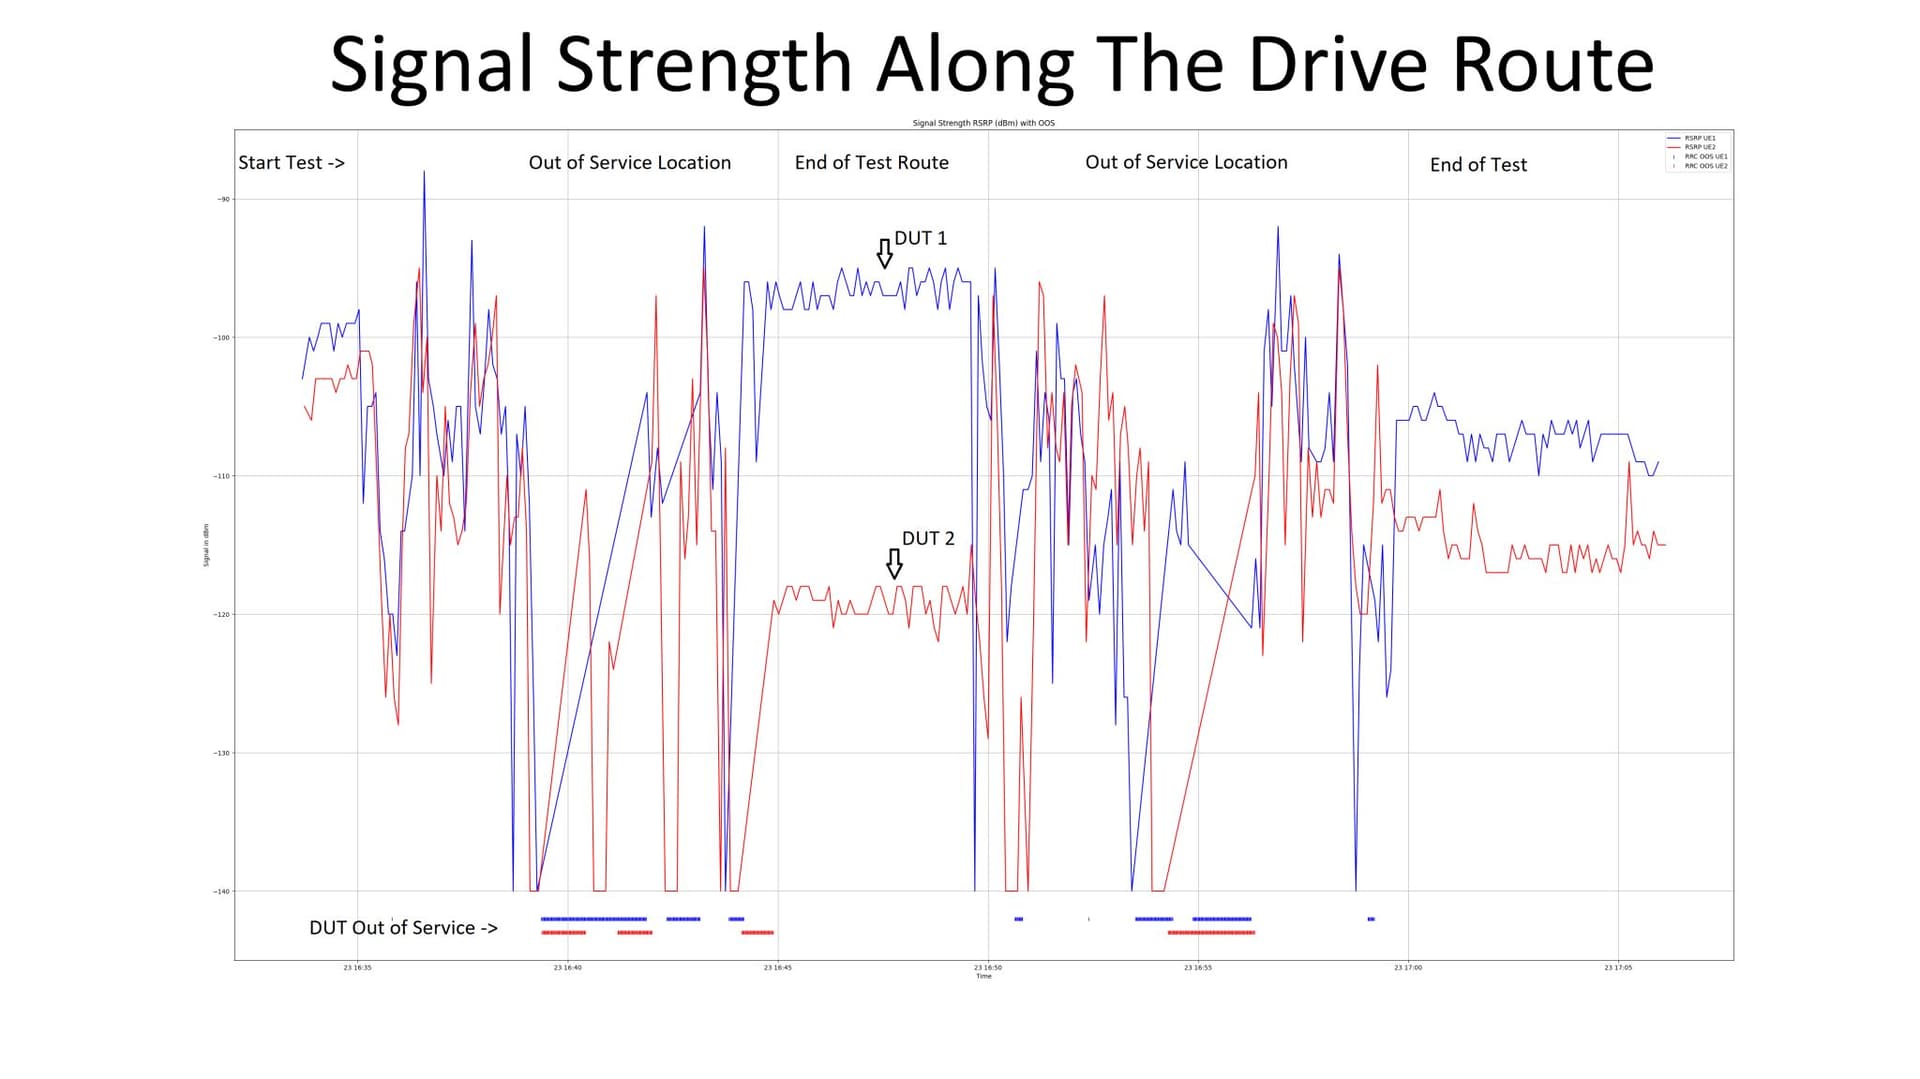
This field test compared two LTE CAT-M devices running in parallel on the same drive route with known out-of-service zones. The graph shows RSRP (signal strength) over time and reveals an unexpected truth.
![]() DUT 1 (blue): Stronger signal, often 20 dB higher
DUT 1 (blue): Stronger signal, often 20 dB higher
![]() DUT 2 (red): Weaker signal, but less time out of service.
DUT 2 (red): Weaker signal, but less time out of service.
![]() Insight: Strong RSRP doesn’t guarantee better real-world coverage. The out-of-service bars, below the graph tell the real story.
Insight: Strong RSRP doesn’t guarantee better real-world coverage. The out-of-service bars, below the graph tell the real story.
![]() Scripted with TeraTerm
Scripted with TeraTerm
![]() Visualized with Python + Matplotlib
Visualized with Python + Matplotlib
![]() Collected in a known weak coverage zone
Collected in a known weak coverage zone
LinkedIn: ![]()
r