Antenna datasheets love quoting “beamwidth” but what does it actually mean for your coverage? Engineers often see the -3 dB points and stop there without realizing how much this simple number shapes real-world performance.
-
What Beamwidth Actually Represents?
Beamwidth is defined as the angular width of the main lobe where the radiated power drops by 3 dB (half power). It sets the coverage footprint of your antenna, dictating how wide or narrow the useful energy spreads but beamwidth alone says nothing about sidelobes, nulls or gain uniformity. -
Narrow vs. Wide! Tradeoffs You Can’t Ignore:
Narrow beams concentrate power, boosting gain and range but requiring precise alignment. Wide beams cover larger areas but sacrifice gain, making them more forgiving in alignment yet weaker over distance. Real-world environments often dictate a compromise between these extremes. -
The Hidden Context Behind -3 dB:
The -3 dB definition assumes an idealized radiation pattern but in practice, clutter, reflections and device orientation can shift the usable coverage significantly. A “60° beam” on paper may behave like 45° or 80° depending on how the antenna interacts with nearby structures. -
Critical Formulas:
a) Half-power beamwidth (HPBW):
θ3dB ≈ 2 × arcsin(0.443λ / D)
b) Directivity approximation:
D ≈ 41,253 / (θE × θH) (in degrees)
c) Gain–directivity relation:
G = η × D -
Real-World Failures from Misunderstood Beamwidth:
- A drone’s “narrow-beam” antenna promised long range but frequently lost link mid-flight because even slight yaw shifted it out of the main lobe.
- A Wi-Fi AP marketed as “wide coverage” struggled in multi-floor setups since its vertical beamwidth was too narrow to reach upstairs rooms.
- A radar unit showed excellent lab beamwidth but clutter sidelobes masked real targets in rain, proving sidelobes matter as much as main lobe.
- An automotive mmWave sensor passed spec tests with 30° beamwidth but failed in dense traffic because reflections outside the -3 dB points dominated detection.
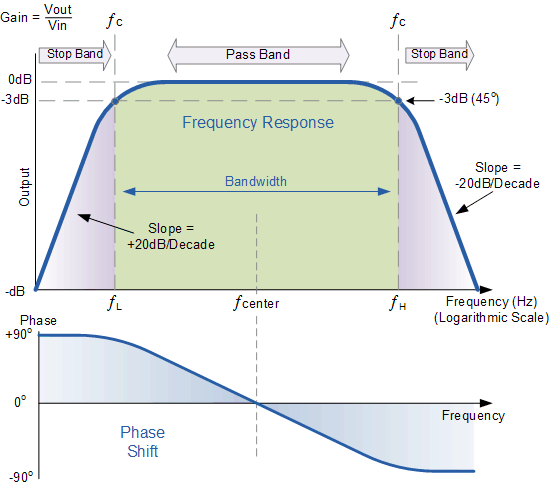
This image below shows how engineers define and measure bandwidth using the classic -3 dB point.
In the top graph, the flat region represents the passband where signals are transmitted effectively while the cutoffs (fL and fH) mark where the output drops by 3 dB, setting the practical bandwidth.
The bottom graph shows how the phase shifts across frequencies, which matters for keeping signals clean and undistorted. In antennas, the same principle applies, the -3 dB beamwidth defines how wide the main lobe spreads, balancing coverage and directivity.
It’s a simple yet powerful way to understand both filter performance and antenna radiation patterns in real-world systems.
LinkedIn: ![]()