Introduction
The representation of sectors across our network of lines as we have seen is sufficient for several tests. However, it is sometimes more interesting to work with symbols instead of simple lines, such as the sector represented by a symbol like a rose petal. Today we will create our first program Mapbasic - where we’ll see how this is done.

Our audience is from students to experienced professionals. Therefore we ask for a little understanding and tolerance if some some of the concepts presented today are too basic for you. Moreover, all the tutorials, codes and programs are at a continuous process of editing. This means that if we find any error, for example, grammar or spelling, try to fix it as soon as possible. We would also like to receive your feedback, informing us of errors or passages that were confusing and deserve to be rewritten.
Goal
From an information table with information about latitude, longitude, and azimuth of the antenna aperture of the sectors of our network, we plot the data using Mapinfo in regions - like rose petals - rather than simple lines.
Input Data
The first step then is to get the table with the necessary fields. Some are required or mandatory, because without them we could not do anything. Others are optional - if they do not exist, we consider default values. They are:
- latitude : latitude of the sector - REQUIRED;
- longitude : longitude of the industry - REQUIRED;
- ant_azim : azimuth of the antenna, determining the direction of our symbol - REQUIRED;
- ant_h : horizontal opening of the antenna, determining the breadth of our national symbol. OPTIONAL: if there is no such field in the table, let us consider for example a standard opening of 65 degrees.
- sectorlength : length of the sector, in meters. OPTIONAL: if there is no such field in the table, let us consider for example a standard length of 300 meters.
- freqband : indicates whether the sector can have two types of symbols, so that when overlapped both appear. For example, in the case of GSM 900/1800, use the BCCHNo, and according to the same plot with one or another kind of symbol. Do not worry, you’ll see it later. It is also an optional field, and if not, consider a default value whatsoever.
Well, we already have data in the table tbl_Network our network, database Hunter_Network_DB.mdb in the directory C: \ Hunter \ Network \ Database. And until now we generate a table and a map in MapInfo with the sectors.
Unfortunately, this table does not contain the information generated (field) of the azimuth of the antenna, we need now. To resolve this problem, the file has downloaded a new version of the file that generates this table (Sectors.TAB) including this field. The file Hunter_MI_Network_1.3_RUN.mdb located in the C: \ Hunter \ IM \ Network \ Scripts.
Note: interesting that you would even try to make this change. Remember that this is a subject you already know. For questions, contact support. Otherwise, simply follow the new ddos provided.
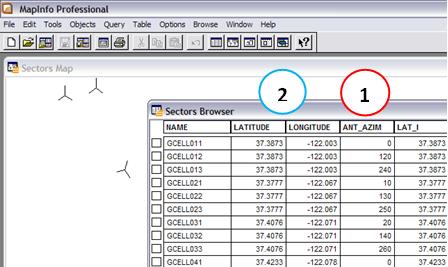
The updated data (Sectors.TAB) already contains the field ant_azim (1). Also required fields latitude and longitude (2). The other fields we will leave it as default.
Important: We are using the data of Hunter Network because they are already available. This is however not a requirement. If you prefer, you can open an Excel table with the fields (at least the required) and create just create points - to create a base map. From this point on you can use the program that we create to make the changes of symbols.
What are programs Mapbasic
Enough talk, let’s work. First, let’s backtrack a little Mapbasic.
The Mapbasic is the program that lets you create executables (more or less as in the VBA macros) to be used in conjunction with the MapInfo, automating tasks, creating forms interface, etc… Unfortunately, it has the interface and poor in resources - virtually the same as Windows Notepad. That is, since it was seen that we have to type everything right?
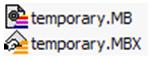
The source files have the extension. MB, and executables. MBX.
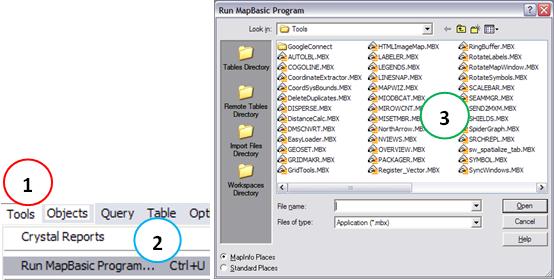
To run a program in Mapinfo MBX you can double click it using Windows Explorer, or access the Menu: Tools (1) -> Run Program Mapbasic … (2). Note that there are several programs available with the installation MBX (3).
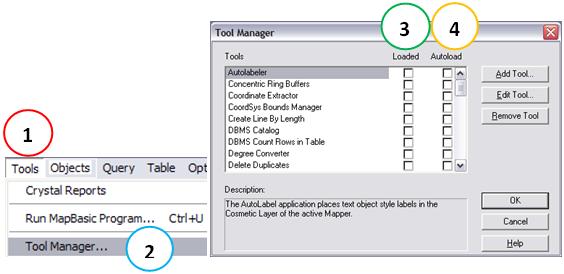
You can also access the Menu: Tools (1) -> Manager Tools (2) and MBX choose which programs should be pre-loaded in the current session only (3), or whether they should be loaded whenever the Mapinfo starts ( 4). Remember we did this for the program GELink.mbx a previous tutorial!
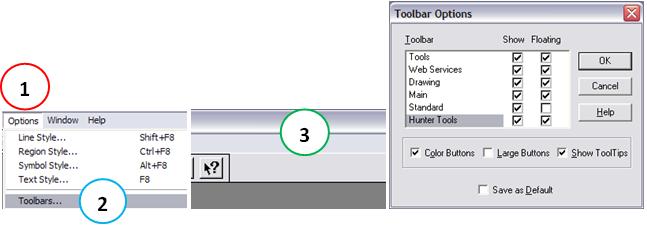
When we run a program MBX can see a toolbar, a menu, both, or even nothing. For our program today, we chose to create a new toolbar. So at the end of this tutorial, when we run our program, you will see the toolbar Hunter Tools, as shown below.

In MapInfo, you can choose which toolbars are available through the menu: Options (1) -> Toolbars (2), or click right on the main bar (3).
Basically we have two buttons, one that runs our program itself, and another with only the same information. Note that we defined icons. Later we will see how.
In addition to the Toolbars, we have included a new menu, but we’ll leave that for another tutorial. More worthwhile to use the menu when you have multiple programs, and divides each into submenus.
You can also create User Interfaces, or dialog boxes to select box, text box, OK button, etc… All too much like what we have forms of VBA. In this first program, we created an interface - dialog box - very simple, just to allow some extra settings, and even show some functions to more Mapbasic.
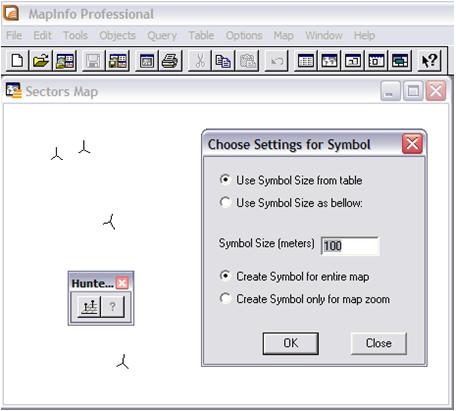
In our case, double-click the table Sectors.TAB (C:\Hunter\MI\Network\Data) and also in the program, with Sectors With the table open, and also the program HunterPlotSectors_v1.0.MBX (C:\Hunter\MI\Network\Scripts).
Clicking on the icon of the network, there is the Main Interface.
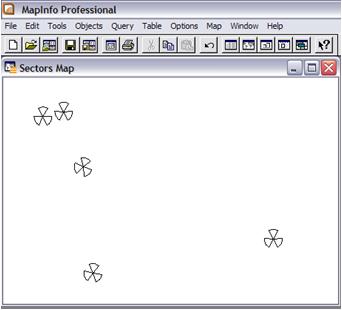
Clicking the OK button, the symbols are plotted.
We also have options to create symbols with different sizes and also create symbols for the area at the current zoom. You can use any combination, depending on what one wants.
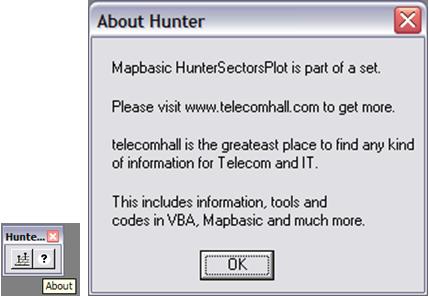
And when we click on the icon of interrogation, we have the program information.
Creating, compiling and running a program Mapbasic
Now on there. If you have never created a program in Mapbasic, let’s make one very quickly.
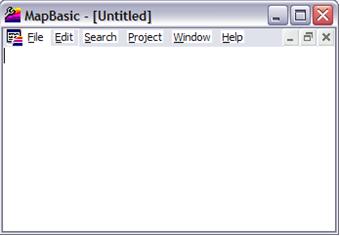
Open Mapbasic, and enter the text below.
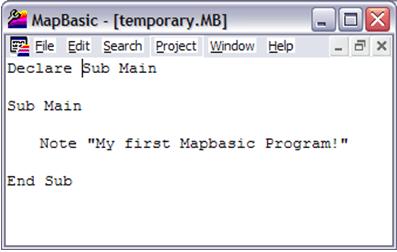
Save the program anywhere, is temporary. Note that it was saved with the extension. MB. Okay, you already have your first program Mapbasic.
Only it’s not possible to run a program MB, MBX only compiled programs. To compile your program, it open, go to Menu: Project (1) -> Select Project File … (2).
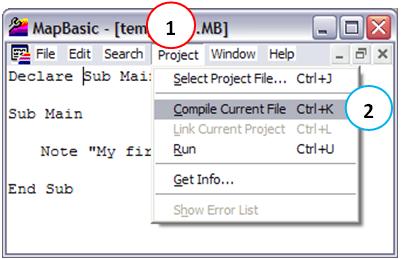
Note: Actually, you’ll realize that with time you’d better use the shortcut keys CTRL + K.
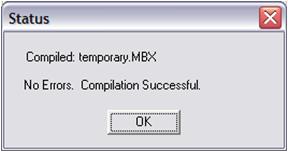
Ready. Check the location where you saved the file temporario.MB. Now we have the compiled temporario.MBX.
Double-click the file temporario.MBX. See what happens.
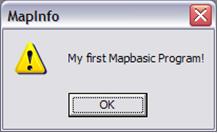
Okay, this program serves no purpose besides informing you the message of his first program in Mapbasic. But that was the point: to demonstrate the procedure for creating, compiling and running. Now we are ready to see the syntax of a real program, the HunterPlotSectos.MBX.
The Code
Finally, just as in the VBA, you can read the program line by line. The code is fully commented - comments also come after a '.
For reasons of space, only parts are shown. Whenever you see “…” means that there is more code, which was truncated, ie it is longer and you can check the entire code provided. And each part has shown parts that are described next.
Our program (and almost all) gets so.
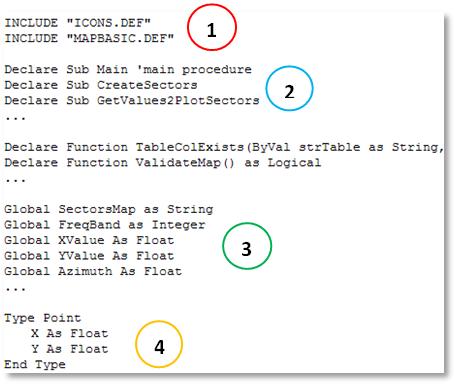
(1) Statement that tells Mapbasic to use the files and also MAPBASIC.DEF ICONS.DEF when compiling the program. These files are located in C: \ Program Files \ MapInfo \ Mapbasic. You can open them, and will see they are a series of definitions that Mapbasic uses. It is more or less like a DLL whose data are available when you include it.
(2) Statements of Procedures (U) and Functions (Function) that we create and use the program.
(3) Declaration of variables - integer, string, etc…
(4) Note that we can, and declare variables themselves. In this case, we define a variable of type point, consisting of values of X and Y, both of type float.
Note: as always mentioned, this is not a programming course. If you have any questions for example about what is a variable of type integer, contact support and help.
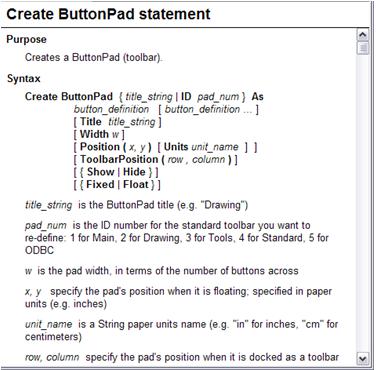
Following, we have the main procedure, where we created the task bar (1).
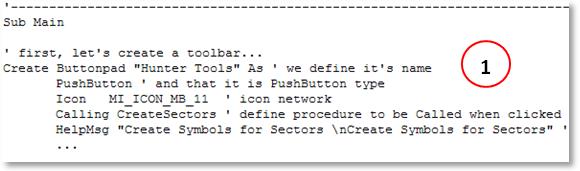
Please note that comments are all in code, which eliminates all be reproduced here. Anyway, this procedure simply create the toolbar Hunter Tools and procedures that are called when each button is clicked.
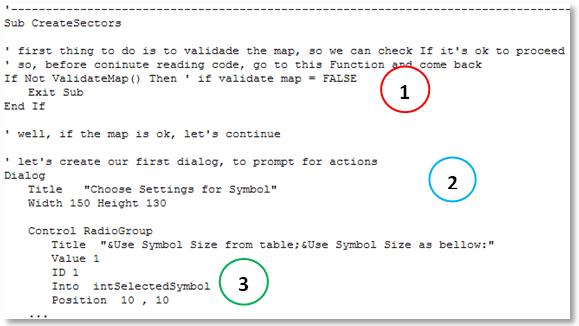
Below, we have the procedure called when the button is clicked to create sectors - CreateSectors. This is the principal. Basically this procedure uses the function ValidateMap () (1) to check if a table with the minimum information required is open. If yes, creates the dialog box (2). We use variables such as intSelectedSymbol (3) to contain the values of the box when the OK button is clicked.
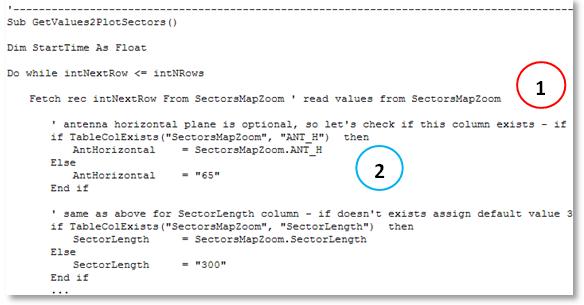
When the OK button is clicked, the procedure is called GetValues2PlotSectors (). This is an intermediate procedure. Basically it reads the values of each record in the table (1) and stores in other variables (2).
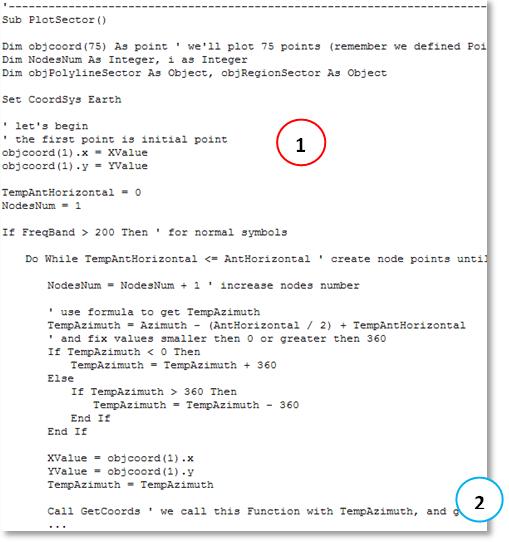
Finally, we have the procedure PlotSector (), responsible for making the calculations, and plot symbols (1). This procedure calls a helper function - GetCoords () (2), which makes the calculations for the points that form the linked rose petal.
The points form an interconnected Polyline - Create Pline, which is then converted into the region - ConvertToRegion ().
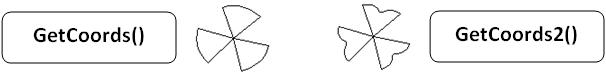
Note: for the case where we need two kinds of symbols, we use the function GetCoords () to a type, and GetCoords2 () to another. So we get different points for each case, resulting in different symbols, as shown below.
We could list the code was much more than the above, but this is not our goal, nor necessary, particularly because the code is fully commented. If you have any questions, please contact us via email or chat.
Too difficult?
Well, the program already functional, and already tested in the beginning. But okay, let’s agree: this is not a program so simple.
Numerous functions are presented, procedures calling functions, error handling, calculations of trigonometry! But if we were to explain each calculation performed, detailing each line, we would lose our focus, which is going to build step by step tool to Hunter.
In future modules of the Hunter, for example those dealing with KPI and parameters, we have code like this, and some much more complex.
But see the other side: you do not have the obligation to learn the codes all at once. You already have everything ready and functional, just use. In a brief tutorial will show how to bind their real data to create applications that will follow. And you can always count on our support.
So do not understand how difficult. Would be difficult if you needed to do everything yourself!
Final Tips
Just to finish by today in a less complicated, let’s see some final tips (for today).
First let’s talk about the icons we use the toolbar Hunter Tools. The icons of predefined Mapbasic are available through the ICONS.DEF file - file that is included (INCLUDE) at the beginning of the program MBX.
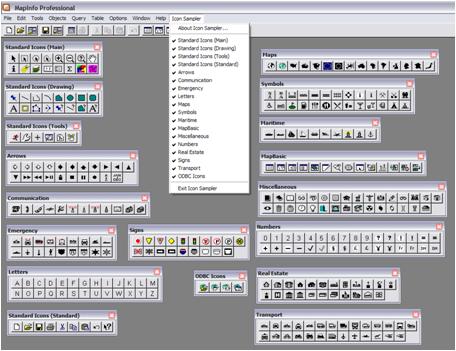
The trick here is that there is a program that lets you see the icons you can use in your application. In the directory C: \ Program Files \ MapInfo \ Mapbasic \ SAMPLES \ Mapbasic \ ICONDEMO ICONDEMO.MB the file exists. Open this file, compile and run - as you should have already learned. Note that there is a new menu Icon Sampler.
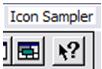
Press each set of icons, as shown below. Then you can choose which icon to use in their applications.
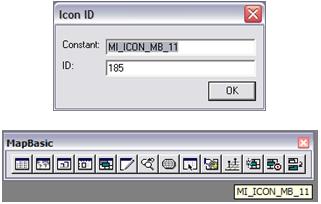
Clicking on each one of these icons, you have the constant that defines it (with the mouse on top also appears which is the constant).
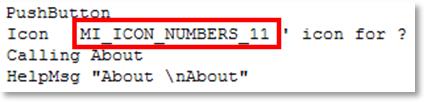
For our code to the button question, see where the information was posted.
Another tip is to learn to use the shortcuts for common tasks:
- CTRL + K : Compile current file
- CTRL + U : Turn the current file
- CTRL + F : Find …
- CTRL + G : Find again
- CTRL + T : Jump to line … (Especially when there’s an error message because the line with error is reported).
And finally, last tip. Whenever you want to know more about a command, for example the syntax for creating a toolbar, use the Help. It is well completed.
Conclusion
With this lesson learned to create, build and run a program in Mapbasic. Specifically, we created a program that takes the data of latitude, longitude and azimuth of an open table in Mapinfo and create symbols to the sectors.
We saw that some programs are not so simple, but the challenge becomes much easier when we have a place of reference.
We hope you’ve enjoyed. If you have any doubts, find the answers posting your comments in the blog or via our support via chat or email.
Till our next meeting, and remember: Your success is our success!
Download
Download Source Code: Blog_010_Hunter_Mapbasic_PlotSectors.zip (96.2 KB)