Nice mesmerizing simulation from Nathan Yau model. ![]()
Each dot represents a person, color represents the activity, and time of day is shown in the top left. As someone changes an activity, say from sleep to a morning commute, the dot moves accordingly.
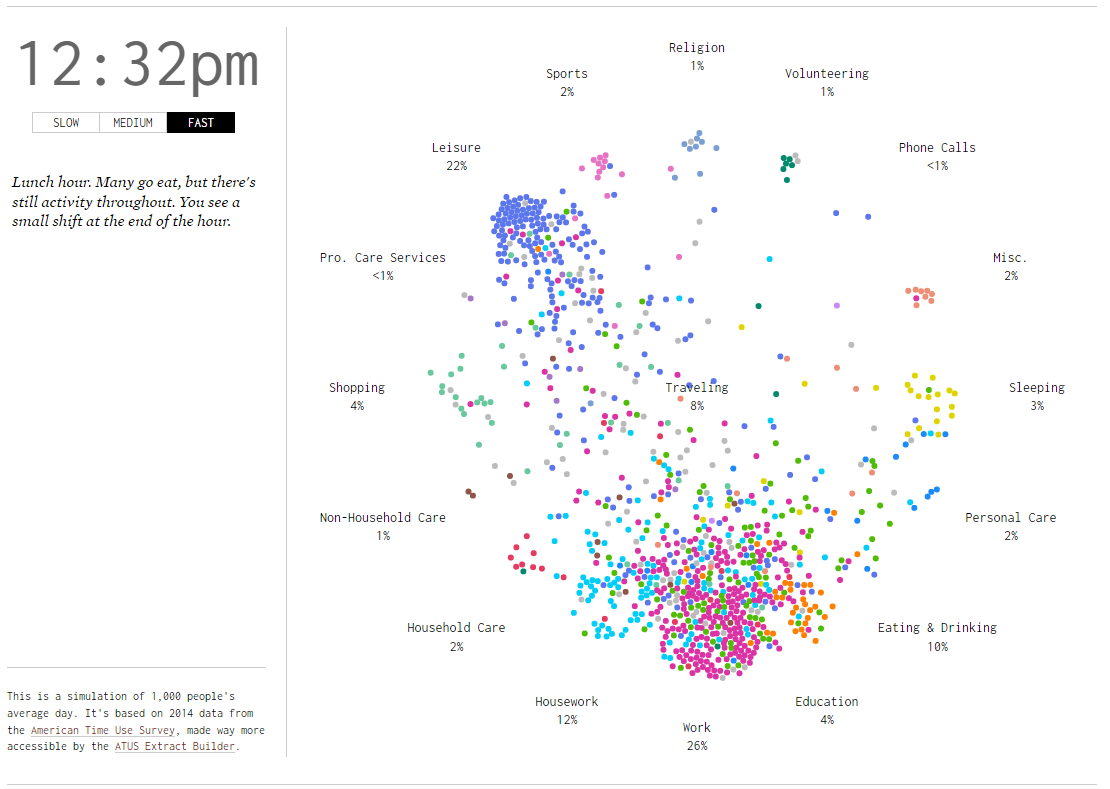
This data visualization is based on the microdata from the American Time Use Survey from 2014, which asked thousands of people what they did during a 24-hour period. The creator (Nathan Yau) used the data to simulate a single day for 1,000 Americans representative of the population — to the minute.
Credit: Nathan Yau